
Is the cyclical bull over?
Mish Moved to MishTalk.Com Click to Visit.
Let's take a look at several indices.
Here is the Nasdaq 100 Index - $NDX
There are clearly 5 waves up with powerful divergences at the top. Notice in particular the volume. There was very heavy selling for weeks at the top while the index went sideways. Sentiment was extremely strong although the index barely surpassed the high from a year earlier. If liquidity dries up this chart can get ugly in a hurry.
Here is the Internet Index - $DOT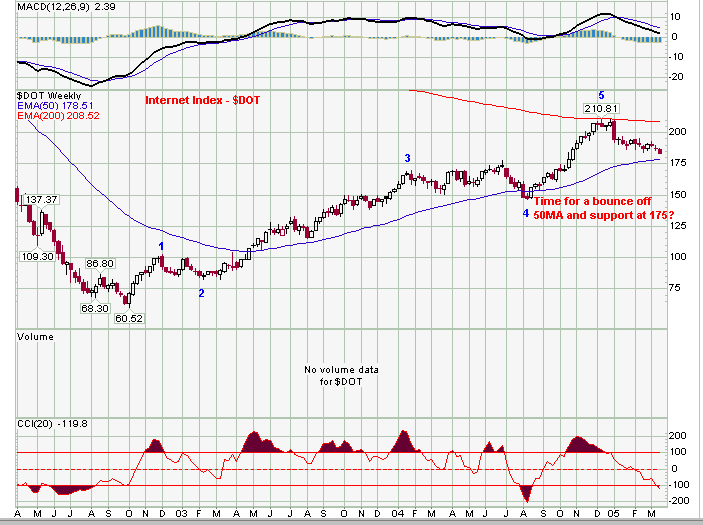
This chart has not yet broken down. It led the Nasdaq advance from the lows and never looked back. Then again the index fell from 1250+ to 60+ so it was more than a bit oversold. Many companies in this index went under. Fundamentally you are looking at the survivors. That said, they are very richly priced after this advance and we have seen 5 clear waves up. Odds do not seem to favor being long here.
Here is the S&P 600 Small Cap Index - $SML
One can easily see 5 waves traced out. We are also flirting with the trendline.
Odds would seem to favor a significant correction here.
A bounce can be expected off the 200MA near 300. If that produces a H&S top rather than taking out the high, we could see a significant drop. After 5 clear waves up the odds for a breakdown vs a breakout seem high given the MACD and CCI divergences.
Here is the Semiconductor Index - $SOX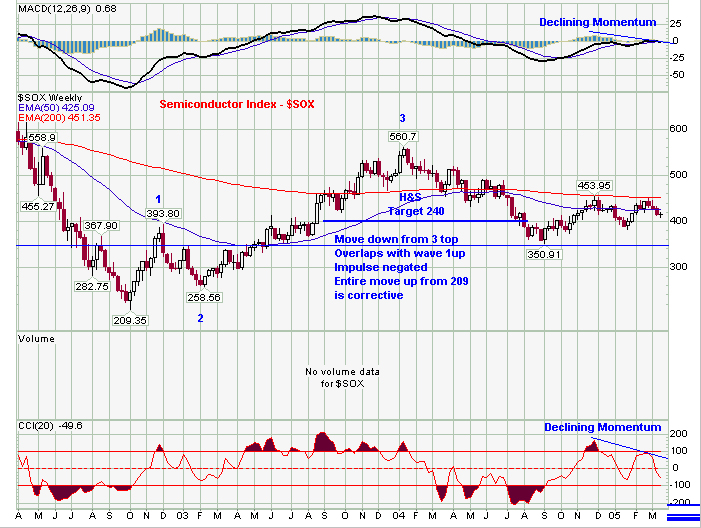
This is one ugly chart and one ugly index. Notice only 3 waves were traced out on this advance from the lows. A potential 4th wave was negated when the wave 1 up was crossed on what presumably was a wave 4 down. Oops Not Allowed. In Ewave terms this makes the entire move off the 2002 lows a corrective advance. This is the weakest of the charts we have looked at today.
Fundamentally there is support for this view based on declining DRAM prices, channel stuffing and lower prices on PCs, falling demand on cell phones, and new factories planned or coming online in China. Seldom do the leaders of the previous bubble lead the advance of the next one. The SOX has clearly lagged and should continue to lag.
There are many charts and many sectors that look similar to the preceeding charts.
On a fundamental basis we are in the worst possible environment for stocks:
1) Rising interest rates
2) A slowing economy
3) Difficult year over year earnings growth comparisons
Although housing is still robust, refis have dried up to a mere 20% of the peak levels just over a year ago. That is not supportive of increased consumer spending. All in all, fundamentally and technically the odds do not favor being long. Odds are this bull move is over. I look for a very significant correction in stocks this year.
Mish


