"Real" and "Unreal" Wages; Five Decades of Middle Class Decline in Pictures
Mish Moved to MishTalk.Com Click to Visit.
What follows is a guest post from Doug Short at Advisor Perspectives. This post has its roots in a discussion we had about "real" (inflation-adjusted) wages.
Doug took our initial discussion and merged it with the number of hours people work.
Here is the decidedly bleak result: Real weekly earnings were $825 in 1973. Today they are $690.
Doug Short Guest Post
As a follow-up on some collaboration with Mike Shedlock in advance of his recent commentary
on wages over time, here's a perspective on personal income for
production and nonsupervisory private employees going back five decades.
The Bureau of Labor Statistics has been collecting data on this
workforce cohort since 1964. The government numbers provides some
excellent insights on the income history of what we might think of as
the private middle class wage earner.
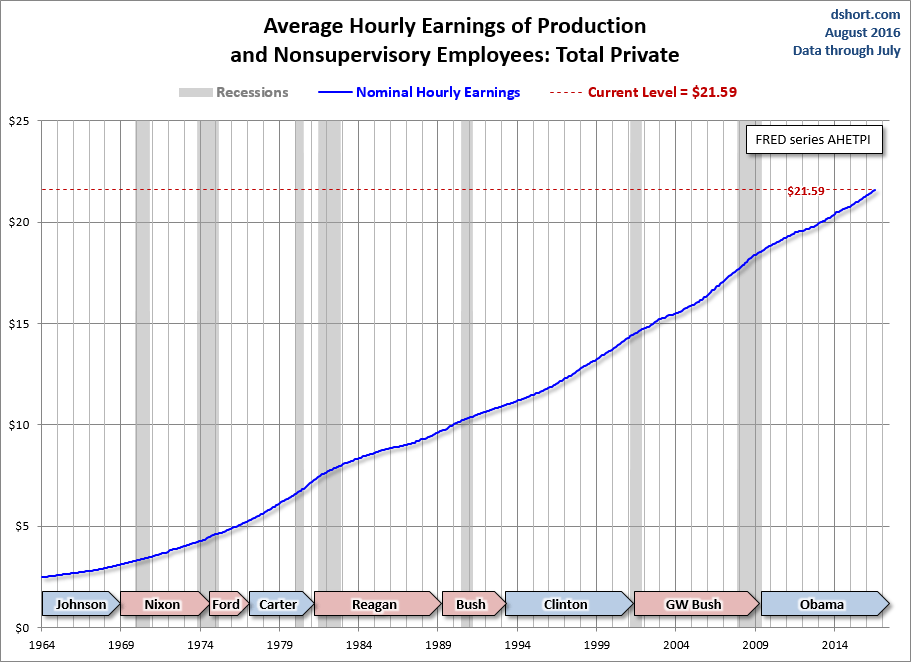
The first snapshot shows the growth of average hourly earnings. The nominal data exhibits a relatively smooth upward trend.
here are, however, two critical pieces of information that
dramatically alter the nominal series: The average hours per week and 2)
inflation.
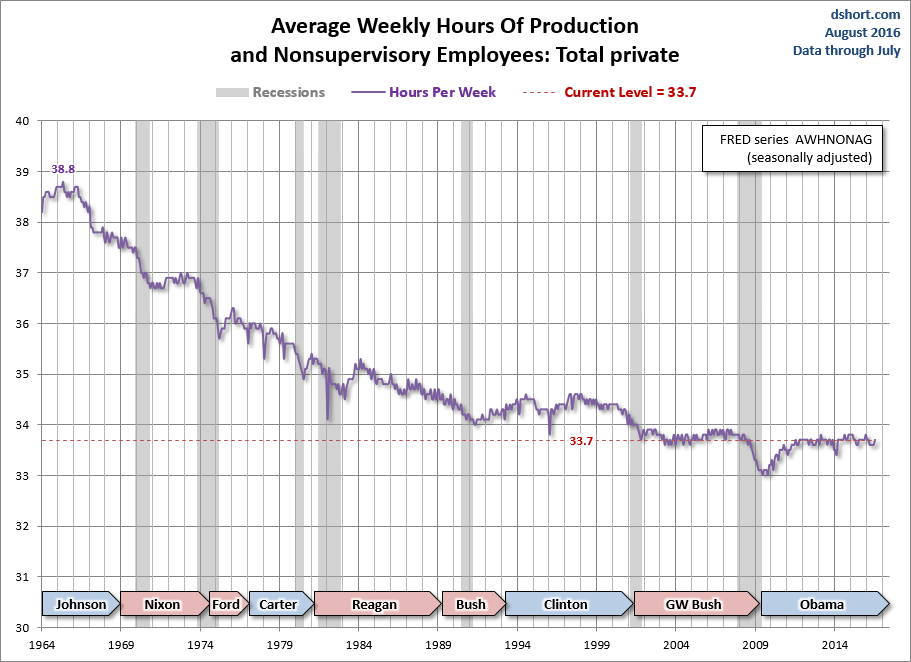
The average hours per week has trended in quite a different
direction, from around 39 hours per week in the mid-1960s to a low of 33
hours at the end of the last recession. The post-recession recovery has
seen a disappointingly trivial 0.7 bounce (that's 42 minutes).
What about inflation? The next chart adjusts hourly earnings to the
purchasing power of today's dollar. I've use the familiar Consumer Price
Index for Urban Consumers (usually abbreviated as the CPI) for the
adjustment. Theoretically, the CPI is designed to reflect the
cost-of-living for metropolitan-area households.

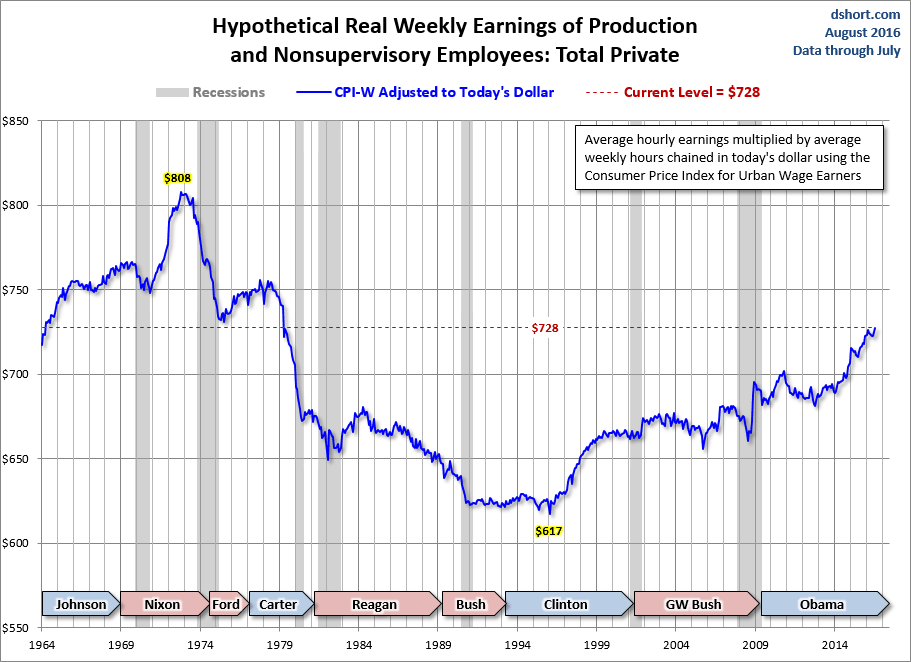
Now let's multiply the real average hourly earnings by the average
hours per week. We thus get a hypothetical number for average weekly
wages of this middle-class cohort, currently at $690 -- well below its
$825 peak back in the early 1970s.
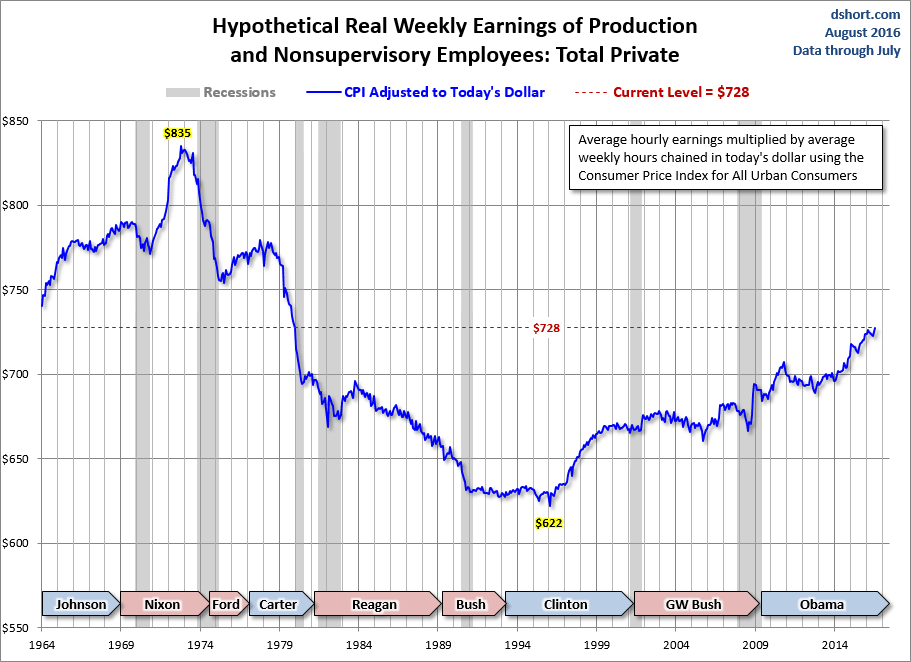
Note that this is a gross income number that doesn't include any tax withholding or other deductions.
Latest Hypothetical Annual Earnings: $35,000
If we multiply the hypothetical weekly earnings by 50, we get an
annual figure of $35,497. That's a 16.4% decline from the similarly
calculated real peak in October 1972. I've highlighted the presidencies
during this timeframe. My purpose is not necessarily to suggest
political responsibility, but rather to offer some food for thought. I
will point out that the so-called supply-side economics
popularized during the Reagan administration (aka "trickle-down"
economics), wasn't exactly very effective for production and
nonsupervisory employees.
Footnote for economist geeks: Here is a
slightly different look at the data. I've adjusted using the less
familiar Consumer Price Index for Urban Wage Earners and Clerical
Workers, which among other things, assigns a higher weighting to
gasoline (e.g., longer drives to work and the grocery store). Also, this
is the series the government uses to calculate Social Security Cost of
Living Adjustments (COLAs).
Here is the real hourly history with this deflator.
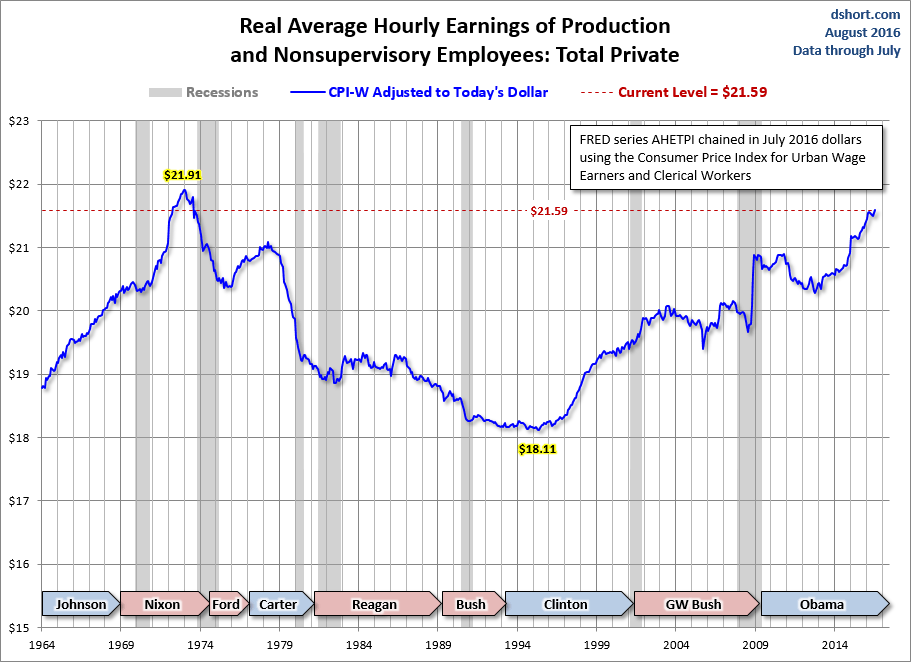
Here is the real hourly data multiplied by the average weekly hours. The latest data point is 14.1% below the 1972 peak.
For additional perspectives on earnings, see my commentaries on household income.
- Monthly Median Incomes Since 2000
- By Quintile and Top Five Percent
- Median Incomes by Age Bracket
- Deflating the American Dream
End Doug Short
Real vs. Unreal Wages and Earnings
I asked Doug if we could factor in social security, disability, and income taxes. Ideally, we would also need to factor in property taxes, sales taxes, and fees.
One might also want to factor in food stamps and other transfer payments.
Unfortunately, there is no realistic way to easily do all that. Instead, let's take a look at Historical Payroll Taxes from the Social Security Administration.
In 1973 the combined Social Security and Medicare payment was 5.850%. Today it is 7.65%.
Given that workers making wages as shown in the charts above would not have hit the FICA limit, it would be reasonable to subtract an additional 1.8% from today's weekly $690 weekly figure.
Each person would need to do sales taxes for their own state. Today the Illinois minimum sales tax rate is 6.25%. Depending on localities, it can be as high as 9.75%.
I cannot find a historical table, probably on purpose. No state would want to publish such a thing, but I seem to recall something like 4%.
Whatever the rate, assuming most people making these wages spend damn near everything, it would be safe to subtract the difference, whatever it is. Do the same for income taxes, which Governor Quinn recently raised from 3% to 5%.
Realistically, there is nothing "real" about "real" earnings and wages. Thus we must look at "unreal" wages (incorporating all of the above ideas) to get the true picture.
It is very safe to say, the decline in "unreal" weekly earnings from $825 in 1973 to $690 today, understates the decline by a huge degree.
"Unreal" wages ignores transfer payments that come out of someone else's pocket.
Of course "unreal" is really "real" and "real" is really "unreal", so it's easy to be confused.
Who to Blame?
I have outlined on many occasions who is to blame for this sorry state of affairs. The answer is the Fed, fractional reserve lending, and government bureaucrats. Nixon closing the gold window was icing on the cake.
The Fed is hell bent on achieving inflation. Wages did not keep up because it was easier to outsource.
In-sourcing is now the buzzword, but the Fed has cost of money so low that it's easy for corporations to borrow money and invest in technology and software to replace workers. That would be a lot harder to do if wages were $2.50 an hour. And most people would be a lot better off if prices were correspondingly lower as well.
Those with first access to money (governments, banks, the already wealthy) are the only ones who gain from inflation. Everyone else loses. The result is a shrinking of the middle class.
Instead of pointing the finger at the real problem, the Fed blames robots and Democrats blame corporations and Republicans. Meanwhile, Republicans and Democrats alike fund wars and other activities via the printing press that the US cannot possibly afford.
If routine price inflation did not benefit the banks and the wealthy at the expense of everyone else, we probably would not have it. The word that best describes the process is "theft".
For further discussion of the demise of the middle class and the role president Nixon and Congress played, please see Time Lapse Image of Growing US Political Polarization; Root Cause of the Shrinking Middle Class
Mike "Mish" Shedlock
http://globaleconomicanalysis.blogspot.com


