
After All the Hype, Jobs Up an Anemic 39,000; Unemployment Rises to 9.8%; Quicksand of Stimulus
Mish Moved to MishTalk.Com Click to Visit.
Today the BLS reports that jobs gained a mere 39,000 and the unemployment rate shot up to 9.8%, the highest rate since April.
Private payrolls gained a mere 50,000 compared to expectations of +160,000. Both jobs and the unemployment rate were worse than every single economist estimate which has me noting once again that economists as a group are sure one optimistic lot.
Check out these Grim Job Details courtesy of Bloomberg.
- Payrolls increased 39,000, less than the most pessimistic projection of economists surveyed by Bloomberg News, after a revised 172,000 increase the prior month, Labor Department figures showed today in Washington.
- The jobless rate rose to 9.8 percent, the highest since April, while hours worked and earnings stagnated.
- The unemployment rate was forecast to hold at 9.6 percent, according to the median prediction of 83 economists surveyed by Bloomberg. Estimates ranged from 9.4 percent to 9.7 percent.
- Overall payrolls were forecast to climb by 150,000, according to the survey median, with estimates ranging from 75,000 to 200,000.
- Manufacturing payrolls dropped by 13,000 in November, the most in three months. Economists had projected an increase of 5,000.
- The report also showed an increase in the number of long- term unemployed Americans. The number of people unemployed for 27 weeks or more increased as a percentage of all jobless, to 41.9 percent, the highest since August.
Two days ago in Challenger Reports Planned Layoffs Highest in 8 Months; ADP Reports Strongest Job Gains in 3 Years; Impact of State Budget Deficits on Jobs I took "the under", guessing the jobs report would disappoint, but admittedly I did so without much conviction.
I don't know what Friday's job number will show, (I am actually slightly inclined to take the under), but regardless of how strong the number is, it would be a serious mistake to extrapolate job growth we see now throughout 2011.If you missed it, please click on the above link for a detailed list of "headwinds".
Over the past half-year I have held to my position that the highs in unemployment rate are not yet in, and I certainly see no reason to back down from that cal today. We are a mere .3% from matching the high.
BLS November Report
Please consider the Bureau of Labor Statistics (BLS) November 2010 Employment Report.
The unemployment rate edged up to 9.8 percent in November, and nonfarm payroll employment was little changed (+39,000), the U.S. Bureau of Labor Statistics reported today. Temporary help services and health care continued to add jobs over the month, while employment fell in retail trade. Employment in most major industries changed little in November.
Unemployment Rate - Seasonally Adjusted 
Bear in mind, were it not for millions of people allegedly dropping out of the labor force over the last year, the unemployment rate would be over 11% right now.
Nonfarm Payroll Employment - Seasonally Adjusted

Note the effect of temporary census hiring earlier this year. For all the hype about the improving economy, there has only been one decent jobs report all year. It was last month, and no doubt influenced by heavier than normal retail seasonal (temporary) hiring.
Establishment Data
click on chart for sharper image
Highlights
- +39,000 jobs
- -5,000 construction jobs
- -13,000 manufacturing jobs
- +65,000 service providing jobs
- -28,100 retail trade jobs
- +53,000 professional and business services jobs
- +30,000 education and health services jobs
- +11,000 leisure and hospitality jobs
- -11,000 government jobs
Index of Aggregate Weekly Hours
Production and non-supervisory work hours fell by .1 to 33.5 hours. Average hourly earnings were flat at $19.19.
BLS Birth-Death Model Black Box
For those unfamiliar with the birth/death model, monthly jobs adjustments are made by the BLS based on economic assumptions about the birth and death of businesses (not individuals).
Birth Death Model Revisions 2009

click on chart for sharper image
Birth Death Model Revisions 2010

click on chart for sharper image
I am actually shocked to see birth-death adjustments not only back in the solar system, but also back on planet earth. I cannot recall the last negative number in any month but January or July.
Birth/Death Model Methodology
The big news in the BLS Birth/Death Model is the BLS is going to move to quarterly rather than annual adjustments.
Effective with the release of January 2011 data on February 4, 2011, the establishment survey will begin estimating net business birth/death adjustment factors on a quarterly basis, replacing the current practice of estimating the factors annually. This will allow the establishment survey to incorporate information from the Quarterly Census of Employment and Wages into the birth/death adjustment factors as soon as it becomes available and thereby improve the factors.
For more details please see Introduction of Quarterly Birth/Death Model Updates in the Establishment Survey
In recent years Birth/Death methodology has been so screwed up and there have been so many revisions that it has been painful to watch.
It is possible that the BLS model is now back in sync with the real world. Moreover, quarterly rather than annual adjustments can only help the process.
Please note that one cannot subtract or add birth death revisions to the reported totals and get a meaningful answer. One set of numbers is seasonally adjusted the other is not. In the black box the BLS combines the two coming out with a total. The Birth Death numbers influence the overall totals but the math is not as simple as it appears and the effect is nowhere near as big as it might logically appear at first glance.
Birth/Death assumptions are supposedly made according to estimates of where the BLS thinks we are in the economic cycle. Theory is one thing. Practice is clearly another as noted by numerous recent revisions.
Household Data
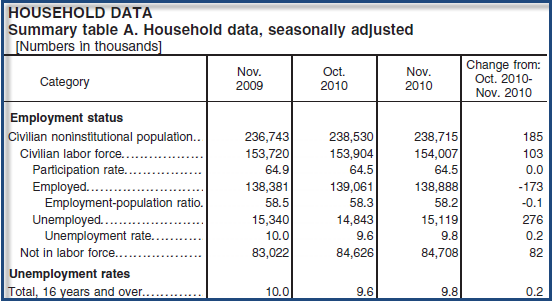
In the last year the civilian population rose by 1,972,000. Yet the labor force rose by a mere 287,000. Those not in the labor force rose by 1,686,000. Had it not been for this drop in participation rate, the unemployment rate would have been 10.8%. Here is the math (15,119+1,686)/(154,007+1,686).
Households Stats
- The number of unemployed persons was 15.1 million in November. The unemployment rate edged up to 9.8 percent; it was 9.6 percent in each of the prior 3 months.
- The number of long-term unemployed (those jobless for 27 weeks and over) was little changed at 6.3 million and accounted for 41.9 percent of the unemployed.
- The civilian labor force participation rate held at 64.5 percent in November, and the employment population ratio was essentially unchanged at 58.2 percent.
- The number of persons employed part time for economic reasons was little changed over the month at 9.0 million. These individuals were working part time because their hours had been cut back or because they were unable to find a full-time job.
- About 2.5 million persons were marginally attached to the labor force in November, up from 2.3 million a year earlier. (The data are not seasonally adjusted.) These individuals were not in the labor force, wanted and were available for work, and had looked for a job sometime in the prior 12 months. They were not counted as unemployed because they had not searched for work in the 4 weeks preceding the survey.
Table A-8 Part Time Status

click on chart for sharper image
There are now 8,972,000 workers whose hours may rise before those companies start hiring more workers, about where we were a year ago. The number is down from last month but massively higher than the reported 8,300,000 reported in January.
Table A-15
Table A-15 is where one can find a better approximation of what the unemployment rate really is.

click on chart for sharper image
Grim Statistics
The official unemployment rate is 9.8%. However, if you start counting all the people that want a job but gave up, all the people with part-time jobs that want a full-time job, all the people who dropped off the unemployment rolls because their unemployment benefits ran out, etc., you get a closer picture of what the unemployment rate is. That number is in the last row labeled U-6.
It reflects how unemployment feels to the average Joe on the street. While the "official" unemployment rate has held steady, at an unacceptable 9.8%, U-6 is much higher at 17.0%
Recap and Reflections
41.9% of unemployed have been out of work for 27 weeks or longer, 59% have been out of work 15 weeks or longer.
The stock market is higher, but things are not improving, at least in the real economy. The stock market is up, because profits are up. Profits are up because of unsustainable stimulus spending, and because corporations are not hiring.
Moreover, China and India are overheating, and Europe is in shambles.
Looking ahead, there is no driver for jobs. States are in forced cutback mode on account of shrinking revenues and unfunded pension obligations. Shrinking government jobs and benefits at the state and local level is a much needed adjustment. However, those state and local government cutbacks will weigh on employment and consumer spending for quite some time.
Keep in mind that huge cuts in public sector jobs and benefits at the city, county, and state level are on the way. These are badly needed adjustments. However, economists will not see it that way, nor will the politicians.
Last month I said "Retail hiring is not sustainable. Nor is the rise in manufacturing. We might see a few more months of this (or not), but this is highly unlikely to be the start of something big or sustainable. I still expect to see the unemployment rate back up above 10% in this cycle. While today's report may not be as good as it gets, it certainly is close to as good as it gets on a sustainable basis."
The "or not" has arrived already. Perhaps we see good December and January numbers, but apparel sales are not going to drive the economy as noted in yesterday's post SpendingPulse: Retail Sales Led by Apparel, Consumer Electronics and Appliances Down
Quicksand of Stimulus
Courtesy of the Greenspan and Bernanke Fed, we threw the biggest housing party in history. This is the payback. No one in mainstream media will say it but I will: There is much more pain to come, and highly likely in the stock market as well. Solid recoveries are not built on the quicksand of stimulus.
Sticking with a message I said on August 18, 2009 "Expect to see the unemployment rate structurally high for a decade."
Addendum:
Please click on this link for further Explanation of last Month's Jobs Upside Surprise and this Month's Downside Surprise
Also consider 6 Million Benefit-Paying Jobs Vanish in One Year!
Things are much worse than this administration would have you believe.
Mike "Mish" Shedlock
http://globaleconomicanalysis.blogspot.com
Click Here To Scroll Thru My Recent Post List

After All the Hype, Jobs Up an Anemic 39,000; Unemployment Rises to 9.8%; Quicksand of Stimulus
Posted by Michael Shedlock at 8:56 AM

