
Housing Industry Employment
Mish Moved to MishTalk.Com Click to Visit.
I came across an interesting graph of Housing Industry Employment in a Center for Economic and Policy Research (CEPR) PDF entitled Is the Housing Bubble Collapsing? 10 Economic Indicators to Watch.
The article was written in June of 2006 so most of the data it was watching (home sales, home prices, etc) is now far out of date. Last on the list of indicators to watch was employment. There it seem the party has just begun.
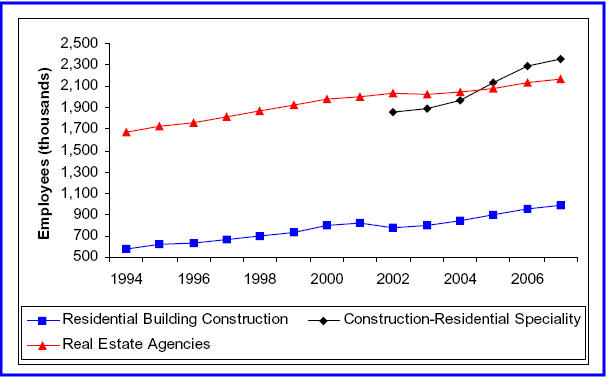
Industry Employment
Data produced by the Bureau of Labor StatisticsIn October Housing Starts, Permits, Foreclosures there was a discussion on housing employment, repeated below for convenience.
The jump in employment in the housing-related series over the last 13 years is a good measure of the impact of the housing bubble. While overall employment increased by less than 22 percent from the 1993 to 2006, employment in the construction of residential buildings increased by almost 70 percent. Employment in real estate agencies increased by almost 30 percent over this period. Employment in residential specialty trade contractors increased by almost 28 percent in just the years from 2001 to 2006.
When the bubble deflates, employment levels in these sectors will fall back in line with their historic patterns, as construction and sales levels move to more normal levels.
If employment in housing-related sectors were to fall back to levels consistent with their share of their labor force in the mid-1990s, it would lead a loss of close to 1 million jobs. If the construction sector temporarily falls below its normal level of activity as inventories of unsold homes adjust to normal levels, the job loss would be even greater.
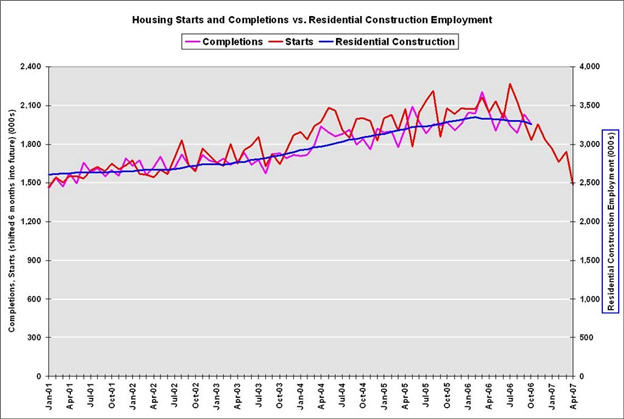
Housing Starts vs. Employment
The following chart is courtesy of CalculatedRisk.Perhaps the above 600,000 jobs loss estimate was a bit on the optimistic side. Then again, perhaps those losses will take a lot longer to play out than the six month period as stated above. The bad news, however, is that the CEPR estimate of a potential 1,000,000 job loss assumes there will be no overshoot to the downside.
It shows residential construction employment vs. housing starts offset by six months.
Click on the chart for an easier to read view.
The chart above shows that although starts have plunged, completions remain high. This has ominous implications for construction jobs looking ahead. Given that employment will follow housing starts with a lag as existing construction completes, it appears that a minimum of 600,000 construction jobs will be lost over the next six months or so.
The ripple effect of the loss of those jobs, especially on consumer spending will be very noticeable. If anything, this may be a best case scenario on the unlikely assumption that starts and permits do not decline further. Note too that with the expected decline in consumer spending as a result of housing sector weakness, layoffs will likely cascade to a wide variety of other jobs especially restaurants and retail sales jobs.
The CEPR estimate also does not address the ripple effect. On the way up, expansion in housing supported all sorts of retail activity like restaurants, nail salons, WalMarts, and Home Depots being built everywhere. The ripple effect ensures that job losses in those sectors will be magnified on the downside as well.
Mike Shedlock / Mish
http://globaleconomicanalysis.blogspot.com/


