
The Exhaustion Process
Mish Moved to MishTalk.Com Click to Visit.
Before we discuss exhaustion, let's take a quick look at some of the best and worst reports on the August New Home Sales figures released today. Following are two brutally slanted headlines.
Bloomberg is reporting New Home Sales in U.S. Rise in August to 1.05 Million Pace
Sept. 27 (Bloomberg) -- New home sales in the U.S. unexpectedly rose in August from a three-year low the month before, signaling a possible pause in the housing slowdown. The median price of new homes fell for the first time since 2003.The Chicago tribune is also touting New home sales rise in August
Purchases of new homes, which account for about 15 percent of the market, rose 4.1 percent to an annual pace of 1.05 million from a 1.009 million pace in July that was less than previously reported, the Commerce Department said in Washington. Inventories slipped 0.4 percent.
Declining mortgage rates and incentives offered by builders helped spur purchases last month, economists say. The Federal Reserve, after raising its key lending rate 17 times in the two years through June, is seeking to engineer a soft landing for the housing market and the broader economy.
"New home sales were surprisingly stable last month given that homebuilders say the outlook continues to worsen," Chris Rupkey, senior financial economist at Bank of Tokyo-Mitsubishi UFJ Ltd in New York, said. "This is likely to be just a one- month respite as inventories remain at high levels and affordability remains a key issue."
Purchases rose in all regions except the West. They rose 21.7 percent in the Northeast to 84,000, 12.2 percent in the Midwest to 156,000 and 11.1 percent in the South to 582,000. Purchases fell 17.7 percent in the West to 228,000.
Economists' surveyed by Bloomberg News forecast sales would decline to 1.04 million from an originally reported 1.072 million pace. Forecasts ranged between 990,000 to 1.1 million.
New home sales in the U.S. unexpectedly rose in August from a three-year low the month before, signaling a possible pause in the housing slowdown. The median price of new homes fell for the first time since 2003.Scrutiny
Purchases of new homes, which account for about 15 percent of the market, rose 4.1 percent to an annual pace of 1.05 million from a 1.009 million pace in July that was less than previously reported, the Commerce Department said in Washington. Inventories slipped 0.4 percent.
About 44 percent of U.S. homebuilders have reduced prices, says Gopal Ahluwalia, director of research at the National Association of Home Builders in Washington, citing a survey he conducted this month.
Net home equity extraction fell to an annualized $141 billion in the second quarter from a $196 billion pace a year earlier, according to Federal Reserve research undertaken by former Fed Chairman Alan Greenspan and senior economist James Kennedy.
Residential construction is also falling as sales slow and inventories accumulate. Home construction detracted 0.6 percentage point from growth in the second quarter, at a time when the economy slowed to a 2.9 percent pace of growth from 5.6 percent in the first three months of the year.
- June sales were revised lower to 1.091 million units from 1.120 million units.
- To get a month to month "increase" of 4.1% it was necessary to revise the prior month lower to -7.5% from -4.3%
- Year over year sales are 17.3% lower than the August 2005

Revisions
New home sales have been revised lower what seems to be about 10 months straight now and every month but 2 since Feb 2005. For all this brewhahha over rising sales, let's see what the numbers look like after next month's revisions.
Jan Initial - 1,233 Revised - 1,173 (Down 4.9%)
Feb Initial - 1,080 Revised - 1,038 (Down 3.9%)
Mar Initial - 1,213 Revised - 1,121 (Down 7.6%)
Apr Initial - 1,198 Revised - 1,121 (Down 6.4%)
May Initial - 1,234 Revised - 1,101 (Down 10.8%)
Jun Initial - 1,131 Revised - 1,091 (Down 3.5%)
Jul Initial - 1,072 Revised - 1,009 (Down 5.8%)
The above data is thanks to James Bedna and the New Jersey Real Estate Report
CalculatedRisk
Some of the best over all reporting on housing, month in and month out, is done by CalculatedRisk.
Here is just one of the many charts in the above link:
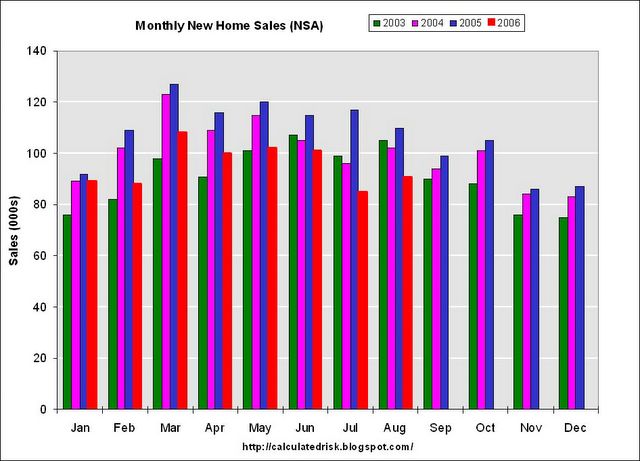
Looking at the above chart I see that 2006 sales are below 2003 sales for three months running now. How long will it be before we are bumping up against 2002 numbers? I expect CalculatedRisk to add 2002 levels to his charts any time now.
Build or Bust
In the meantime note that Lennar CEO keeps building despite cooling housing market.
Standing in a hallway at Lennar's offices, chief executive Stuart Miller clears his throat. He then proceeds to recite the entire seven stanzas of Scratchings From The Little Red Hen by heart.Notice how Lennar and others keep building with the expectation of being able to "offer sales incentives and slash prices to get the homes sold." Obviously that is going to continue to put pressure on prices. I have no doubt that shrinking margins coupled with continued overbuilding while holding rising amounts of inventory is going to bankrupt some national homebuilders. The forementioned plan of Lennar to slash and burn is likely to (or at least should) put share buybacks on hold, as well as accelerate the typical bust cycle.
These days, the poem is taking on a whole new significance. After a housing boom of more than a decade, the long-awaited downturn has finally hit with a speed and force few anticipated. Home-builder confidence has dropped to its lowest in 15 years. Cancellations are up. And new construction is down to a level not seen in three years.
Perhaps worst of all, it's hard to tell when things will get better.
"It doesn't feel like we can identify a bottoming yet," said Miller, who recently downgraded Lennar's earnings estimates for the year. "It happened very quickly, very suddenly. I can't identify the trigger."
Or put in the words of The Little Red Hen: "What's become of all those fat ones is a mystery to me; There were thousands through the rainy spell, but now where could they be?"
This month three stock analysts downgraded Lennar's stock -- two from buy to hold and one from hold to sell. Bank of America analyst Daniel Oppenheim cautioned that a record number of homes on the market for sale coupled with overbuilding will result in "sharply lower margins" in the next two years for Lennar.
Lennar's response: Keep building.
Miller plans to "keep the conveyor belt running" and finish building new homes in projects already underway. He also plans to offer sales incentives and slash prices to get the homes sold.
It's an approach shared by several home builders, such as Centex in Dallas and D.R. Horton in Fort Worth. Others, such as Pulte Homes in Michigan and KB Homes in Los Angeles, have taken a different tack. These builders are scaling back production but holding firm on prices until buyers return -- a strategy some have called quality over quantity.
However, the pressure is on. KB Homes chief executive Bruce Karatz said Thursday price concessions and incentives by other builders have "required us to do the same in some cases."
Builders build until they go bust (or as long as they get financing whichever comes first). That is the pattern in every downturn.
One thing that could prolong the life of some homebuilders is a combination of falling lumber prices, copper prices, and perhaps roofing products. However, carrying costs with rising inventory have to be skyrocketing. The builders holding the most inventory with the least amount of cash reserves are likely to be those in the most trouble.
Triggers
I would have thought that by now Miller would have figured out what the "trigger" was to this downturn. Perhaps the answer is just too simple for many to understand. The trigger (or lack thereof really) is called exhaustion.
The short version of the process is simple: "The pool of greater fools dries up".
The long version of the process is as follows:
The Exhaustion Process
- After years of price runups, people started buying homes not to live in but for investment purposes. In 2004 and 2005 a whopping 40% of all homes sold were for second homes or for investment purposes.
- The above happened in spite of the fact that home prices to wages relationships, and home prices to rental prices had both risen 4 standard deviations above norm.
- Credit standards steadily declined to rock bottom levels such that anyone who could fog a mirror could get a loan
- Lenders passed on risk to hedge funds, pension plans, etc who could not get enough of what eventually will become toxic waste, but at the time seemed like a good idea. Risk yield spreads collapsed as people started assuming prices of houses would never decline.
- Fannie Mae lost billions in derivative hedging as interest rates gyrated but no one really cared.
- Homebuilders provided down payments via charities to those who could not afford to buy a house. The IRS has been looking into this practice and it may be illegal.
- Magazine covers, books, and financial wizards of all sort were touting "Buy now before prices rise further".
- All sorts of creative financial products were unleashed on the unwary.
- As the pool of eligible and willing buyers shrank, subprime loans, pay option arms, and stated income loans soared as a percentage of all loans. Anything and everything was done to keep the bubble expanding.
- The masses embraced the trend just as it was ending.
- Panic buying reached a peak in the Summer of 2005 with people camping out overnight in Florida to buy condos for ridiculous prices hoping to flip them. No one bothered to figure out there was no one to flip them to.
- David Lereah, chief propagandist for the National Association of Realtors, published the same book twice. His book "Are You Missing the Real Estate Boom?" was published in February 2005 about 6 months before the peak. One year later in February 2006 (about 6 months after the peak) Lereah retitled his book "Why the Real Estate Boom Will Not Bust—And How You Can Profit from It."
- Pent up demand collapsed and home sales plunged. The pool of greater fools, reached its pinnacle, depending on location, somewhere between Summer of 2005 and Winter of 2005.
- The unwinding process has really just started.
- Given that the housing boom lasted for close to 20 years and sustained panic buying happened over a 3-5 year period, selling capitulation and inventory work off can easily take 7 years or more. We are nowhere close to selling exhaustion.
- Global wage arbitrage, outsourcing, rising bankruptcies, and rising unemployment will ensure this process will take a long time to fully unwind.
- Prices will continue to fall until bankruptcies and selling exhaustion are in.
Mike Shedlock / Mish
http://globaleconomicanalysis.blogspot.com/


