
Point of Maximum Risk
Mish Moved to MishTalk.Com Click to Visit.
I found an interesting chart last week on the point of maximum financial risk. I would like to give proper credit, but I am unsure of the original source. The coloured highlights are mine.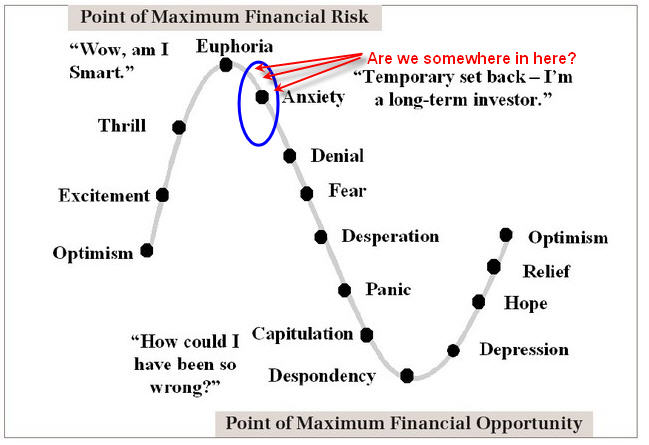
What may be unique is the last US equity cycle never got to despondency. Perhaps we reached despondency on various Nasdaq issues, but stocks in general did not get to typical bear market troughs, and investors (as opposed to speculators) never really threw in the towel. Indeed one short panic was quickly overturned with the DOW almost getting back to a new all time high, and the Russell making a new all time high. Various emerging markets exploded in a flood of liquidity as speculators have returned in full force fueled by various carry trades and an unsustainable housing boom.
Given that it took Japan 18 years to hit bottom, is it really possible the US managed to pull off a cycle reversal after a 3 year decline? One question then is "where are we at in the cycle?" The second relevant question is "For What?" Most likely the last US equity downturn was interrupted by the biggest liquidity experiment the world has ever seen with Japan, China, and the US all taking part. On the other hand, gold and commodities seem to be on the rebound perhaps approaching optimism. Japan has clearly bottomed and arguably somewhere near hope or relief. It is impossible to measure these points with pinpoint accuracy but some things are so out of whack that relative judgments are easily possible.
Treasury Spreads
One measure of investors willingness to take on risk is a measure of Treasury spreads to junk. The following chart is thanks to Orkrious on Silicon Investor. He plots spreads daily and posts his chart weekly. The coloured highlights and trendlines are mine.
How much lower can junk spreads get? Corporations have been even going to the junk bond market to raise money for the sole purpose of stock buybacks. Image going in debt to buy back shares of stocks after a 3 year equity runup? Does that make any sense (except for insiders selling into those buybacks?). It certainly does not seem to make much sense from the point of view of the investor.
The pertinent question is: Is this a trend reversal or will risk junkies plow back in? Given the recent action in the stock markets worldwide I sense a shift away from risk. That will not bode well for the markets if it continues. Indeed it appears that Global Liquidity is in the 9th Inning. I will have a followup piece on Monday or Tuesday about various carry trades that will help tie all of these ideas together.
Another way to look at risk spreads is emerging market spreads vs. US Treasuries.
There was a very interesting historical chart posted last week on Minyanville by Professor Bennet Sedacca on Lehman Brothers Emerging Markets Yields vs. US Treasuries. The key point (if the chart is not assessable to you) is that the spread between emerging market debt and US Treasuries has shrunk from over 900 basis points in October of 2002 to about 150 basis points in early 2006.
Bennet Sedacca has been hitting them out of the ballpark on Minyanville with his treasury analysis and he is a key reason why I am a subscriber. At any rate, that low spread is another sign of near unbelievable appetite for risk. Such risk is seldom rewarded over the long haul.
PE Levels
Another measure of risk is PE levels. With various market cheerleaders touting high earnings and sinking PEs, one might think that stocks are reasonably valued here. Not so fast, says John P. Hussman of Hussman Funds in a recent article entitled The End of Excellent Earnings. Following is the key chart from the article. Once again the red annotations are mine. I also cleaned up years and percentages a bit to make them more readable.
Hussman writes:
The blue line (right scale) depicts U.S. corporate profits as a percentage of nominal GDP. The violet line (left scale, smoothed) depicts U.S. personal disposable income as a percentage of nominal GDP, using an inverted scale – a rising line means a falling disposable income share. Notice that increasing corporate profits as a share of GDP generally come at the expense of wage earners' share, and vice versa.The above are a few key highlights from an excellent piece. I recommend clicking on the link above and reading the entire article. Some people on various stock boards that I post on have been critical of Hussman's timing at various points this year, but not me. Just because risk is rapidly rising does not mean stocks will immediately fall.
The extent of this widening in profit share and profit margins is unprecedented, and isn't something that's likely to be sustained in a competitive economy. Historically, profit margins have been strongly mean reverting, with large swings as the economy moves between recessions and recoveries. Importantly, it doesn't take a plunging economy or falling revenues to hurt profit margins – even a deceleration of growth is typically enough to put downward pressure on margins.
So while profit margins are at record highs, disposable income as a percentage of GDP is closing in on record lows. Once profits become a large share of GDP and unemployment falls to relatively low levels, earnings growth is typically disappointing over the following 2-3 years. With corporate profits pushing above 9% of GDP, the unemployment rate at just 4.6%, and S&P 500 earnings at the top of their 6% long-term growth channel, investors should not be at all surprised to see “surprising” wage inflation, accompanied by disappointing profit margins and weak earnings growth in the next few years.
One of Hussman's comments that I find interesting is a warning about rising wages. With outsourcing still in full swing and spreading rapidly from manufacturing to the service sector, I see no reason for strong wage growth. On the other hand, once everything has been outsourced that can be outsourced, wages may have nowhere to go but up. Also we do not yet know what the final immigration bill will look like, or if one will get passed at all. There could be huge unforeseen consequences of an ill-time or poorly written immigration bill.
I can also see how wages might rise (for those that have a job - eg wages at Walmart rise), even as huge numbers of job losses occur in the housing sector. Wages went down with rapidly rising productivity. Will wages rise on falling productivity? Will wages rapidly rise in China and India? Regardless of what wages do for those who have a job, I expect mammoth layoffs in the housing sector and that will cause rapidly escalating bankruptcies and foreclosures as well as "time preference shock" for consumers with money. The savings rate has nowhere to go but up, and that alone does not bode well for an economy hooked on ever expanding credit.
Signs of Excessive Risk Taking
- Junk bond spreads vs treasuries are extremely low
- Emerging market spreads vs treasuries are extremely low
- Negative savings rate in the US - First time since the 1930's
- Housing values 4-5 standard deviations above the norm vs rents
- Housing values 4-5 standard deviations above wage growth
- Various emerging market equities rising 100% or more in less than a year
- Forty percent of homes sold in 2004 and 2005 were second homes or for investments
- Signs of speculation in various commodities and currencies
- Rampant increase in derivatives
- Lending standards are still falling in spite of rising bankruptcies and foreclosures
- Stock buybacks easily financed with junk bond offerings
Did anyone learn a thing from the Nascrash of 2000? If so, what? Once again, it's as if everyone seems to think they can get out at or near the top. Not only is that mathematically impossible, I get the strong feeling that most players are not even aware of the enormous rise in risks even as there are clear signs that the global liquidity ship is beginning to sink.
Mike Shedlock / Mish
http://globaleconomicanalysis.blogspot.com/


