
Cheerleader Panic, the HPI, and the Battle of New Orleans
Mish Moved to MishTalk.Com Click to Visit.
Speaking for the National Association of Realtors on June 6th, David Lereah, the NAR’s top cheerleader had this to say:
Home sales are settling into a slower pace. “In recent years we were occasionally challenged to find appropriate superlatives to describe surprisingly high home sales,” he said. “Now the housing market has cooled, but 2006 is still expected to be the third strongest on record. In this case, experiencing a slowing from a hot market is a good thing because we need a solid housing sector to provide an underlying base to the economy, and slower appreciation will help to preserve long-term affordability. But this is a time for the Fed to pause on rate hikes because we have some interest-sensitive housing markets that have become vulnerable.”Let's summarize:
- This year will be the "third strongest on record".
- Slowing from a hot market is a "good thing"
- "Slower Appreciation will preserve affordability"
- "The Fed should Pause"
Which one of the above does not logically fit in?
Ding Ding Ding the answer of course is number 4.
Lereah is now in panic mode, talking out of both sides of his mouth at the same time. I am not the only one that noticed this either.
In "Burning Down the House" Independent economist Bob Brusca had this to say: The 10-year note is still yielding just 5%, and 30-year mortgage rates are still historically reasonable. In that light, Mr. Lereah's demand "smacks of desperation," and might cause enough alarm to make potential first-time home-buyers more likely to stay on the sidelines. "I would see this as a mistake [on Mr. Lereah's part] and not an indicator of bad things to happen," Mr. Brusca said, adding: "Except for home builders."
On that note the telepathic question lines are now open. Two questions are repeatedly pouring in.
Q1: Gee Mish, wasn't it just a few short days ago that bulls were bragging about 12% annual appreciation?
A1: Yes indeed. In fact I have the release straight from the Office of Federal Housing Enterprise Oversight (OFHEO): OFHEO House Price Index Shows Annual Rise of 12.5 Percent.
WASHINGTON, D.C. – U.S. home prices were 12.54 percent higher in the first quarter of 2006 than they were one year earlier. Appreciation for the most recent quarter was 2.03 percent, or an annualized rate of 8.12 percent. The quarterly rate is about one percentage point below the rate from the previous quarter and is the lowest rate since the first quarter of 2004. The figures were released today by OFHEO Acting Director James Lockhart, as part of the House Price Index (HPI), a quarterly report analyzing housing price appreciation trends.What Gives?
“These data show average housing prices still growing stronger than some might have expected,” said Lockhart. “They do indicate, however, that price growth is moderating in some parts of the country, particularly in areas where prices have been rising the most.” House prices continued to grow considerably faster over the past year than did prices of non-housing goods and services reflected in the Consumer Price Index. House prices rose 12.5 percent, while prices of other goods and services rose only 4.2 percent. “Increasing sales inventories are apparently giving buyers greater bargaining power, while increasing interest rates are dampening demand," said OFHEO Chief Economist Patrick Lawler.
Significant findings in the HPI:
- Arizona continues to exhibit the greatest appreciation rate, although price growth has dropped significantly in that state. Quarterly appreciation in Arizona dipped from approximately 7.4 percent to 3.8 percent, while its four-quarter appreciation dropped from over 35.5 percent to 32.8 percent. Quarterly appreciation rates were off significantly in the Tucson and Phoenix-Mesa-Scottsdale MSAs.
- Rapid increases continue to be widespread in Florida. Out of the 20 MSAs with the largest percentage house price gains in the past year, 10 were in Florida.
- Prices continue to rise in some areas affected by Hurricane Katrina. Appreciation rates were particularly robust in New Orleans-Metairie-Kenner, LA and Hattiesburg, MS.
- For the first time since the fourth quarter of 2002, negative quarterly appreciation rates were observed for some states. Iowa and South Dakota both experienced small price declines between the fourth quarter of 2005 and the first quarter of 2006.
- The Pacific Census Division has regained its position as the fastest appreciating division, overtaking the Mountain Division.
- Appreciation rates over the past year remain lowest in the East North Central Census Division, which includes Wisconsin, Illinois, Indiana, Ohio, and Michigan. Both the four-quarter and the quarter-over-quarter appreciation rates declined by more than half a percent in that division.
I have to admit being shocked by that report which shows home prices up over 12% annually. In fact Florida prices (which I know 100% without a doubt to be crashing) were supposedly up quarter to quarter.
OK Mish so what gives? (That was a random telepathic question that just snuck in). What gives is "The Methodology" behind the Home Price Index (HPI) is flawed.
I bounced some of my ideas off my good friend CalculatedRisk as well as Jack McCabe of McCabe Consulting and Mike Morgan of MorganFlorida. One of my ideas was there was some sort of assumption made about uniform appreciation. For example: A house sold 3 years ago for X, sold today for Y, and the methodology assumes that the rate of appreciation was a uniform (Y-X)/3.
Given that there was a parabolic spike last year, uniform appreciation would have been a horrid assumption especially for the six months following the spike. However CR informed me he did not see that particular flaw in the formula. I remain unconvinced but on that point you might be better off trusting his statistical skills rather than mine.
We did decide however that there are indeed some other serious flaws in the methodology. Here are 4 of them:
1) The universe is only Freddie and Fannie conforming homes. The conforming limit for '06 is $417,000. That is far too low for many bubble areas. Only the cheapest homes can use conforming loans. This problem may have understated bubble busting effects in places like Florida, D.C. and Boston.
2) The formula is based on closings. Prices at closing may or may not reflect current sales prices. For example closing in January were on 2005 sales (perhaps delayed by 1-2 months). Was a delay of 1-2 months significant? Probably. Housing peaked in July or August of 2005 so a 1-2 month delay in reporting would have the effect of showing positive appreciation for perhaps 9-10 months instead of 8 months. The effect of this flaw would likely be greatest at a turning point.
3) Incentives, discounts, "free upgrades", "free cars, boats, trips etc" dramatically increased in the 4th quarter of 2005 in response to rapidly falling demand and rapidly rising inventories. The methodology does not capture those incentives.
4) The HPI includes appraisal values. This is probably the most serious error and the
OFHEO even has a chart of it. That chart appears below.
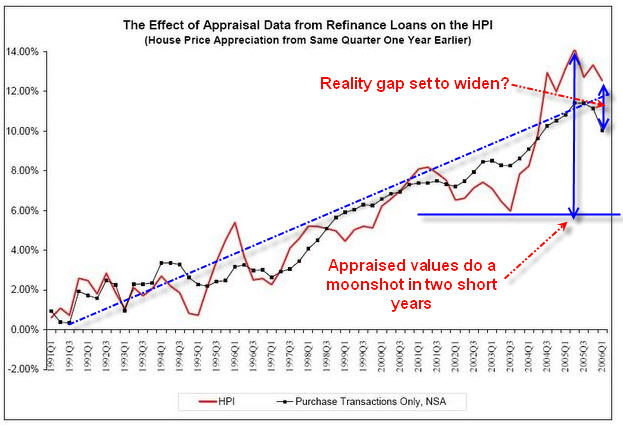
That is a pretty big gap between reality (what a house sells for and its appraised value). It also does not include incentives that have recently skyrocketed. The dramatic rise in inventories strongly suggests that people can not get those appraised values.
Looking back, that gap likely accounts for some of the willingness of consumers to spend their every last dime and then some. Hmmm let's see: Appraisal values skyrocket and the saving rates goes negative. Are they at all related? Cause effect relationships are often hard to state with any degree of accuracy but there is no doubt there was a lot of cash out refis based on those appraised values. I expect that there will be some huge problems in relation to this fact somewhere down the road.
For now I believe we can safely conclude that home prices did not really up go anywhere close to 12% year over year. We can also conclude that comparisons going forward are likely to be extraordinarily brutal. Furthermore, to the extent that the Fed believes those HPI numbers, they may be inclined to keep their foot on the brakes far too long. I will have more on that point later.
It's time now to tackle question #2.
Q2: What is David Lereah really worried about?
A2: Lereah knows things are rapidly deteriorating or he would not be so contradictory. But the three things that probably worrying him most are inventory, inventory, and inventory. The next four things he is worried about are falling sales, falling prices, rising foreclosures, and rising bankruptcies. Let's take a quick look at some recent inventory charts.
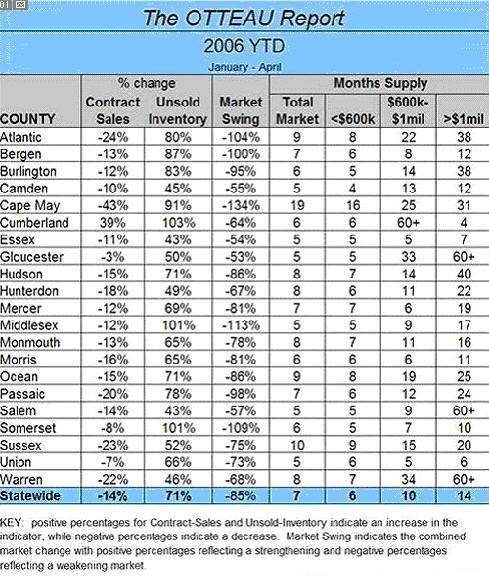
New Jersey
Check out the inventory numbers and the months supply
Orange County

Fairfax County Virginia

There is little atypical about any of the above charts.
Florida looks the same way and I am sure countless other places do too.
Beneath the facade I sense David Lereah is in a near panic.
How long he can remain an optimistic cheerleader rooting for a team down 20 points in the fourth quarter with under 2 minutes left remains to be seen. I am already ready for the next ploy: "Homes won't stay at these prices forever". He will of course be correct. Prices will head lower, much lower. We have only just begun to unwind the craziness of the last few years.
The Marin Real Estate Bubble Blog captured this recent image of David Lereah:

Mish Reflective Moment
The biggest battle in the war of 1812 was fought after the war was over and the peace treaty signed. The Battle of New Orleans , also known as the Battle of Chalmette Plantation, took place on January 8, 1815, at the end of the War of 1812, when the United States forces defeated the British. The Treaty of Ghent, which ended the war, had been signed over two weeks earlier, but the news had not yet reached the southern front.
The Fed is in a similar situation. They are now finally (after 16 rate hikes) worried about the battle that they should have been fighting three years ago.
Mike Shedlock / Mish
http://globaleconomicanalysis.blogspot.com/


