
Thoughts on Housing Construction
Mish Moved to MishTalk.Com Click to Visit.
Housing construction increased in September to the highest level in seven months according to the Commerce Department's most recent data. Construction of new homes and apartments rose by 3.4 percent last month to a seasonally adjusted annual rate of 2.11 million units, the fastest pace since last February. Analysts had been forecasting that housing construction would decline by 1.7 percent in September, believing that increases in mortgage rates would finally start to cool the red-hot housing market.
We will soon find out if September was one last hurrah or if the party continues. New Residential Construction data for October 2005 will be released on Thursday, November 17, 2005, at 8:30 A.M. EST.
Previously we reported The party is over in Boston but optimism still abounds in many market. City by city the party light will go out but the name of the game right now seems to be "Build or Die".
Following is the Weekly Mortgage Applications Survey for the week ending October 21.
WASHINGTON, D.C. (October 26, 2005) - The Mortgage Bankers Association (MBA) today released its Weekly Mortgage Applications Survey for the week ending October 21. The Market Composite Index, a measure of mortgage loan application volume, was 679.1, a decrease of 7.9 percent on a seasonally adjusted basis from 737.5, one week earlier. On an unadjusted basis, the Index increased 2.2 percent compared with the previous week but was down 3.7 percent compared with the same week one year earlier.Even though Long term interest rates have pretty much been rising for several months and rates are at the very upper end of their ranges, overall refinancing avtivity is still reasonably strong 42% of the total volume of mortgage applications. There are several possible explanations that I can think of.
The seasonally-adjusted Purchase Index decreased by 7.4 percent to 466.4 from 503.9 the previous week whereas the Refinance Index decreased by 8.5 percent to 1916.8 from 2095.7 one week earlier. Other seasonally adjusted index activity includes the Conventional Index, which decreased 8.1 percent to 1014.3 from 1103.8 the previous week, and the Government Index, which decreased 4.9 percent to 120.1 from 126.3 the previous week.
The four week moving average for the seasonally-adjusted Market Index is down 1.5 percent to 706.2 from 716.8. The four week moving average is down 0.9 percent to 478.4 from 482.6 for the Purchase Index while this average is down 2.3 percent to 2031.2 from 2078.7 for the Refinance Index.
The refinance share of mortgage activity decreased to 42.5 percent of total applications from 42.8 percent the previous week. The adjustable-rate mortgage (ARM) share of activity increased to 29.5 percent of total applications from 29.3 percent the previous week.
The average contract interest rate for 30-year fixed-rate mortgages decreased to 6.06 percent from 6.09 percent on week earlier, with points decreasing to 1.21 from 1.29 (including the origination fee) for 80 percent loan-to-value (LTV) ratio loans.
The average contract interest rate for 15-year fixed-rate mortgages decreased to 5.57 percent from 5.62 percent, with points increasing to 1.30 from 1.29 (including the origination fee) for 80 percent LTV loans.
The average contract interest rate for one-year ARMs increased to 5.37 percent from 5.34 percent one week earlier, with points remaining at 1.00 (including the origination fee) for 80 percent LTV loans.
- People are so desperate for cash to support ongoing consumption that they are simply forced to pay higher rates to get it
- People have once again racked up huge credit card purchases and are going thru yet another round of paying off high interest debt for lower interest debt
- People are scared to death of all these rate hikes and are rushing to lock in fixed rates and get out of their ARMs
Many seem to thing that housing will plateau and there is no fear of a real slump. At the top of the list in believing the "permanently high plateau" theory is David Seiders, the chief economist for the National Association of Home Builders. According to Seiders, single-family starts numbered about 1.6 million, in 2004. He expects another record this year, even as the industry begins to hit "the plateau we've been watching and waiting for." Next year, Seiders said, he projects 1.58 million single-family-home starts.
Also chiming in on the permanently high plateau theory is Erik Bruvold of the San Diego Regional Economic Development Corp. in the San Diego News article Housing economists raise yellow flag over San Diego.
Mr. Bruvold predicted a flattening in prices rather than a dramatic falloff. Already, the inventory of homes on the market is growing and sales prices are lower than asking prices. "I think we've hit a plateau," Bruvold said. "I would not refer to it as a turning point."
David Berson chief economist of Fannie Mae and David Seiders, chief economist for the National Association of Home Builders also seem to be giving some credence to the "plateau theory". "Prices are so high that at some point there is the possibility people may simply decide it's too expensive to move there," Berson said. "Alternatively, prices may simply slow for a period of slow or no price gains."
David Seiders said constraints on supply will tend to keep prices from falling. "That makes me think prices are going to stick," he said.No one seems to be as optimistic as the Toll Brothers according to the New York Times article Closing Ground.
At the moment, Toll controls enough land for nearly 80,000 houses. Its competitors, which tend to build lower-priced houses on smaller lots, have even larger accumulations. K. Hovnanian has land for more than 100,000 houses. Pulte Homes holds 350,000 sites. Still others - Lennar, Centex Homes, D. R. Horton, KB Home - control hundreds of thousands as well. And all of them are in ferocious pursuit of more."Why can't real estate just have a boom like every other industry? Why do we have to have a bubble and then a pop?" asked Toll.
The company expects to grow by 20 percent for the next two years and then will strive for 15 percent annually after that. Those estimates suggest that the company's expected production of around 8,600 houses this year will expand to at least 15,000 houses by 2010. Individual Toll developments now range in size from a few dozen to 3,000 houses.
I wonder: Does Toll have any idea of what housing prices would look like if prices grow at 15-20% rate annually? Clearly it is silly at best and dishonest at worst to suggest such a thing. Does he really believe this or is this just yapping for shareholders? From where I sit, it's a pipe dream to think that this expansion can continue with housing affordability at all time lows, and real wages falling. What Toll is suggesting is financially impossible.
All of these housing cheerleaders sound just like Yale professor Irving Fisher, who just before the stock market crash in 1929, declared that stocks had reached "a permanently high plateau."
Mish's view of the "Permanently High Plateau" theory is right here:
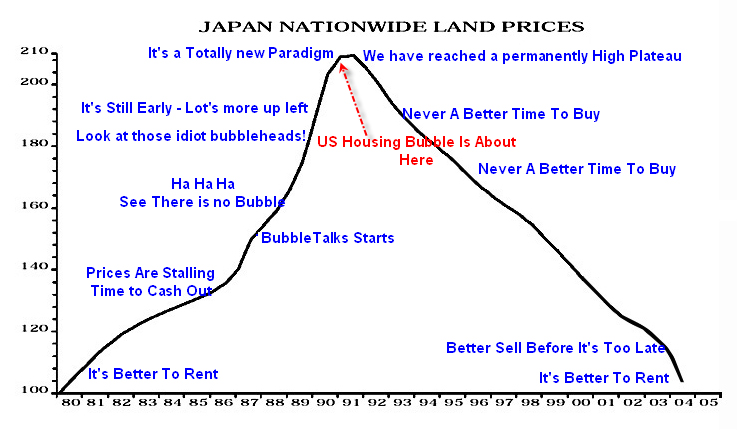
Note: I made that chart in spring of 2005. Please mentally shift the arrow one notch to the right. Perhaps we stay up here a bit longer forming a broader top, perhaps not, but there sure will not be anything remotely permanent about this plateau.
When Toll asks: "Why can't real estate just have a boom like every other industry? Why do we have to have a bubble and then a pop?" I wonder: Has Toll ever studied economic cycles? Is his memory so poor that he has already forgotten what happened 4 years ago in a stock market bust led by telecom and dot coms? Exactly what boom is he referring to that "like every other industry" can go on forever?
Susan Wachter, a housing economist at the Wharton School at the University of Pennsylvania, remarks: "The fact of the matter is that housing prices are increasing in the U.S., faster than inflation, in ways we haven't seen before. Ten years running. It's the first time in keeping these numbers that we've ever had a run like that." Mish asks: Does that sound remotely sustainable?
Noland sure nailed it in a recent Credit Bubble Bulletin
Analyzing today’s Mortgage Finance Bubble does bring to mind speculative dynamics at play during the late-eighties commercial real estate Bubble. Despite increasing signs of late-cycle stress and fundamental deterioration (rising vacancy rates, over-supply, and sagging rents), it took quite some time to pacify (and then quickly crush) the speculative spirits that had blossomed during the boom. The boom-time financial infrastructure and the resulting Wall of Liquidity continued to finance additional building, with both the quantity and quality of the projects guaranteeing a devastating down-side of the Credit cycle. We saw similar dynamics at work throughout the tech and telecom industry during that fateful period 1999/2000.It is actually "build or die" for all of the home builders. Private companies could simply pull their chips off the table, finish selling what inventory they have, scale down and slowly go towards extremely high cash ratios. If Toll Brothers did that, their stock would crash. Thus, Toll Brothers and all of the other public home builders will buy land and build and attempt to expand no matter what the market climate is, no matter what the cost of materials is, and no matter what national housing inventories levels are. As public companies, being bearish is simply not an option no matter how bleak things might look. This is exactly why home builders go bankrupt at the bottom of every cycle. It happens every time. Builders will keep building as long as banks will lend them money. They will not stop because they fear they will lose their crews, their market share, or their stock options. Home builders will run under the model of "build or die" until margins are squeezed so hard they sustain heavy losses. At some point "build or die" will morph into "stop building or die". At that point concerns about market share and promises of 20% growth will both go out the window. By then it will be too late.
Today, the system is basically preordained to finance and construct at least two million new residences a year, notwithstanding fundamental developments (rising inventory of unsold units!). Too many of these homes will be oversized, upscale, and constructed in the hot/susceptible markets (California, greater Washington D.C., Miami, Las Vegas, etc.). The vulnerable condo, investment property and vacation home sectors will see more than their share of construction activity. And the reality of the situation is that this housing juggernaut is destined to pressure exiting home prices and exacerbate post-Bubble system impairment. You can throw any notion of a self-adjusting and correcting system out the window.
This cycle will not be any different. I do expect some home builder bankruptcies out of this mess but it is not easy to predict which ones.
Here is what the housing evidence suggests:
- Homebuilders are clearly ignoring business cycles, affordability issues, tightening credit, and liquidity concerns. Money has been too easy for too long for anyone to understand what might happen in a liquidity crunch.
- Homebuilders will keep buying more and more land and adding more and more to housing inventory in a foolish attempt to grow 20% every year fighting for "market share" right at the peak of the boom.
- No one seems to see or believe the devastating consumer led recession that is staring them in the face. It's simply "build or die".
- People will likely borrow to buy this housing bubble until lending literally seizes up.
Mike Shedlock / Mish
http://globaleconomicanalysis.blogspot.com/


