Every time the US dollar ticks lower, commodity prices tick higher, or the CPI rises two tenths of a percent, hyperinflationists come out of the woodwork with nonsensical predictions and silly comparisons to Zimbabwe or Weimar Germany.
Given that the US dollar recently fell to the lower end of its trading range, hyperinflationists once again came forth with their message of impending doom.
Silly Comparisons to Weimar Germany
Please consider The Time to Prepare for Hyper-Inflation is BEFORE It EXPLODES
by Graham Summers.
The similarities between the US today and Weimar pre-hyperinflation are striking. As in Weimar, US fiscal authorities are not taking any steps to rein in their loose money policies. Similarly, the US Fed, like Germany’s financial elites believes that currency depreciation is a good thing.
Thus we have a rather frightening set-up for hyperinflation in the US: the largest emerging market players are moving away from using the US Dollar at the same time that US monetary authorities are engaging in disastrous policies similar to those employed by the men who brought hyperinflation to Weimar Germany.
I firmly believe the US will see serious (‘70s style inflation) if not hyperinflation within the next 2-3 years. It could come sooner depending on how the Fed’s policies play out.
Similarities? What Similarities- Germany lost World War I
- The Treaty of Versailles imposed repayment conditions on Germany that could not be met
- To enforce the treaty, France occupied parts of Germany
- Germany printed money so fast people burnt stacks of money for heat
What part of that remotely resembles anything that is happening in the US today?
Reserve Currency and Trade Nonsense
The rest of Summers' post focuses on global trade and a move by some countries to replace the US dollar as the world's reserve currency.
Indeed, it was just revealed that ASEAN+3 countries (Brunei, Cambodia, Indonesia, Laos, Malaysia, Myanmar, the Philippines, Singapore, Thailand, Vietnam, China, Japan, and South Korea) are researching the prospect of a “common currency” similar to the Euro.
The significance of this development cannot be overstated.
The article to which Summers' refers is
ASEAN+3 RESEARCH GROUPSignificance of Asean Currency Proposal Wildly OverstatedSummers says the significance of the development cannot be overstated. Of course it can and Summers proves it.
Just because someone writes a paper does not make it credible.
The ASEAN currency proposal was written by three professors in Malaysia. Their proposal is not under serious discussion by any country that matters, if indeed by any country at all.
Given the enormous problems with the Euro related to currency unions without fiscal unions, why would any country in their right mind barge into such an arrangement now or any time soon?
Even if a few minor countries would agree to do such a thing, it is preposterous to believe Japan and China would agree to a common currency.
Every now and again an Asian currency union of some sort surfaces. Every time they are trumped up as if it is going to happen soon. They won't because the proposals are nothing but silly hype and wet dreams.
By the way, there might very well be a currency trading index of Asian currencies similar to the US dollar index, but that will have no effect on anything, just as the US dollar index does not cause anything to happen.
Real but MeaninglessSummers notes that China, Russia, Brazil, India, and now South Africa are moving to trade more in their own currencies (not the US Dollar), saying "All of these items are real and documented."
Yes they are real. They are also essentially meaningless. It makes perfect sense for countries that trade with each other to do so in their respective currencies. Even though oil is priced in dollars, oil trades in Euros right now. Oil trades in Yen now. Currencies are fungible. So if a few minor countries want to trade in Yuan now, it will not matter one iota in the grand scheme of things.
Meaningless facts, academic papers by Malaysian professors, and silly comparisons to Weimar Germany do not constitute a rational thesis for hyperinflation.
Confident PredictionsIn
Signs Hyperinflation Is Arriving Gonzalo Lira foresees an "imminent currency collapse" and "confidently predicts"
- By March of 2011, once higher commodity prices reach the marketplace, monthly CPI will be at an annualized rate of not less than 5%.
- By July of 2011, annualized CPI will be no less than 8% annualized.
- By October of 2011, annualized CPI will have crossed 10%.
- By March of 2012, annualized CPI will cross the hyperinflationary tipping point of 15%.
CPI CheckInquiring minds are looking at the
May 13, CPI Release from the BLS.
The Consumer Price Index for All Urban Consumers (CPI-U) increased 0.4 percent in April on a seasonally adjusted basis, the U.S. Bureau of Labor Statistics reported today. Over the last 12 months, the all items index increased 3.2 percent before seasonal adjustment.
By October of 2011 we will all be able to look at that set of predictions and have a good laugh.
A Good Laugh NowI you want a good laugh now, Lira writes ....
2012 will be the bad year: I predict that hyperinflation’s tipping point will be no later than the first quarter of 2012. From there, it will accelerate. By the end of 2012, I would not be surprised if the CPI for the year averaged 30%.
By that point, the rest of the economy—unemployment, GDP, all the rest of it—will be in the toilet. By that point, the rest of the economy will no longer matter: The collapsing dollar will make 2012 the really really bad year of our Global Depression—which is actually kind of funny.
It’s funny because, as you know, I am a conservative Catholic: I of course put absolutely no stock in the ridiculous notion that “The Mayans predicted our civilization’s collapse in 2012!”—that’s all rubbish, as far as I’m concerned.
It’s just one of those cosmic jokes that 2012 will turn out to be the year the dollar collapses, and the larger world economies go down the tubes.
As cosmic jokes go, all I’ve got to say is this:
Good one, God.
That's supposed to be credible hyperinflation analysis?
John Williams on the Weak DollarPlease consider
The Energy Report interview
John Williams: Weak Dollar Behind Inflationary Oil Prices. Here are a few select quotes from Williams (JW), the Energy Report (TER), and my responses to them.
JW: Let's say the U.S. wants to sell debt to Japan, but Japan doesn't like the way the U.S. is running fiscal operations. It can say, "We don't trust the U.S. dollar. We'll lend you money, but we'll lend it in yen." Then, the U.S. has a real problem because it no longer has the ability to print the currency needed to pay off the debt. And if you're looking at U.S. debt denominated in yen, most likely you would have a very different and much lower rating.
Mish Response: Williams makes a fundamental mistake regarding trade. Several of them in fact. The US does not go about wanting to sell debt to Japan or China. Rather Japan and China buy US debt as a mathematical consequence of trade imbalances.
Moreover, Japan and China are more dependent on the US for their export model than the other way around. The odds China or Japan would not take US dollars is virtually zero. Both economies would crash without exports to the US. China's unemployment would soar and so would political unrest.
I keep stating, and it keeps falling on deaf ears, that as long as the US runs a trade deficit, it is a mathematical certainty that some country is accumulating US dollars or US dollar denominated assets.
Rather than repeat myself again I will simply point to several article regarding trade.
JW: It is possible lenders would not buy the Treasuries unless denominated in a strong and stable currency. As the USD loses its value and becomes less attractive, people will increasingly dump dollar-denominated assets and move into currencies they consider safer. And you'll see other things; OPEC might decide it no longer wants to have oil denominated in U.S. dollars. There's been some talk about moving it to some kind of basket of currencies—something other than the U.S. dollar, possibly including gold. This would be devastating to the U.S. consumer. You'd get a double whammy from an inflation standpoint on oil prices in the U.S. because the dollar would be shrinking in value against that basket of currencies.
Mish Response: Once again we see the silly statements regarding the pricing of oil in Euros or some other currency from someone who does not understand that currencies are fungible.
It does not matter one iota what oil is priced in unless one tried to do it in Yap Island stones or some other highly illiquid currency. Oil already trades in Euros and Yen just as gold does. One does not need dollars to buy oil any more than one needs dollars to buy gold. Currencies are fungible. I remain amazed at the number of people who trip over this simple construct.
JW: If, hypothetically, you're pricing oil in yen, there's no reason for anybody to hold the USD. The dollar would sell off more rapidly against the yen and oil inflation would be even higher in a dollar-denominated environment.
Mish Response: As stated above pricing currency is irrelevant. Moreover, whether or not there is a "need" to hold dollars is irrelevant. Countries will accumulate US dollars and US dollar assets as a mathematical function of trade.
That said, there is a need to hold dollar, real and perceived. China needs to hold a certain amount of dollars to prepare for repatriation of hot money inflows speculating on a rise in the Renminbi. Moreover, neither Japan nor China wants their currency to rise out of fear it would hurt exports and lower employment. China is particularly worried about a slowing economy and is overheating now as a consequence.
TER: You've mentioned that hyperinflation will happen as soon as 2014. If that is true, wouldn't OPEC want to shift off dollar pricing as quickly as possible?
JW: From a purely financial standpoint, that would make sense. Other factors are at play, though, including political, military and unstable times in both North Africa and the Middle East. Those who are able to get out of dollars, I think, will do so rapidly and as smoothly as possible.
They will sell their dollar-denominated assets. They will convert dollars to other currencies. They will buy gold. Generally, they will dump whatever they hold in dollars and sell the dollar-denominated assets they don't want. There's a market for them; it's just a matter of pricing. As the pressure mounts to get out of the USD, the pricing of dollar-denominated assets will fall, which in turn would intensify that selling. The dollar selling will intensify domestic U.S. inflation, which is one factor that picks up and feeds off itself and will help to trigger the hyperinflation.
Mish Response: The setup is ridiculous given that oil pricing unit is irrelevant. The series of answers by Williams shows how one very poor idea involving oil priced in something other than US dollars cascades step-by-step into a preposterous overall thesis.
Moreover Williams' responses also depict the typical one-sided US dollar centric focus of most hyperinflationists.
Predictions- Lira sees hyperinflation starting now, and it will be in full swing in 2012 with the CPI up at least 15% and as much as 30% or more.
- Williams says "hyperinflation will happen as soon as 2014"
- Summers sees "serious (‘70s style inflation) if not hyperinflation within the next 2-3 years."
MyopiaHyperinflationists have myopia. They only see (or only focus on) problems in the US. They ignore overheating in China, enormous problems in the UK, and huge structural issues in the EU.
The US may have more problems than elsewhere (or not), but that does not imply the dollar might collapse to zero against the currencies of other countries.
Intermediate-term, I actually expect the dollar to rise, but should it sink, it will not be a sign of impending hyperinflation.
Massive Inflation in ChinaThose looking for a huge inflation problem can find it in China. Credit growth in China is rampant. Please consider
Ponzi Financing Involving Copper Trade Gone Wild In ChinaChina is building cities no one lives in, malls that are vacant, trains and airports no one uses yet Williams thinks the Yuan is better than the dollar. Why? For that matter why is the Euro or the British Pound?
The entire global banking system is insolvent.
US Total Credit Market Debt Owed US M1 Money Supply
For all the massive amount of printing the Fed has done, note that total credit market is roughly 27 times the size of M1 and roughly 6 times the size of M2 (not shown).
Can that credit be paid back? The answer is no and it will act as an economic drag for a long time.
So another trillion in printing is going to cause hyperinflation? When the total credit market is $50 trillion? Please be serious.
Total Consumer Credit Total Loans and Leases of Commercial Banks
Bernanke is trying like mad to get banks to lend and consumers to borrow. Instead consumers continue to pay down or default on debt.
Hyperinflation is a Political EventLet's go back to the beginning, with a definition of the word: Hyperinflation is a complete loss of faith in currency. Typically a political event, not a monetary event is the cause.
Jeff Harding at the
Daily Capitalist asks
Why Does Hyperinflation Occur?In every modern case of hyperinflation the decision to inflate was a political one, not an economic one. In almost every case hyperinflation followed a war or a coup or some massive political change such as the end of the Soviet empire or the rise of a dictator or a populist-socialist takeover, and other political unrest.
In the 20th Century there were quite a number of hyperinflationary events. I used the Wikipedia list of modern hyperinflations (Since WWI) and researched the political circumstances of each country. The circumstances can be put into three rough categories: post-war disruption, post-Soviet collapse, and socialist-populist regimes.

For example we all know what happened in Germany during after WWI when politicians, mostly socialists, blamed all their problems on reparations and continued to print so much money that it resulted in the famous cash-in-a-wheelbarrow photos. They literally had no clue what they were doing.
The post-Soviet empire collapse is easier to understand as former communist/socialist regimes fought for power and struggled with economic policy. Many of these countries have reformed or were forced to reform their monetary and fiscal policies.
Many of the socialist-Marxist regimes were Latin American populist governments who employed “revolutionary” anti-capitalist nostrums for economic policy. Chile (Allende) and Argentina are good examples. Argentina has had years of high inflation to hyperinflation since 1980. In Africa most countries were a mixture of strongmen with socialist-Marxist policies. I am not suggesting that these were pure socialist governments, but rather the typical situation where the government seizes or controls large parts of industry and issues regulations controlling much economic activity.
These hyperinflations all had one common denominator: during a period of instability, spending was used as a political tool and it got out of hand. I understand that the circumstances of each country were different and that it is perhaps unfair to say, lump Israel in with Argentina. But each country faced political factors that created instability or a national crisis; the government spent heavily to gain popular support, and resorted to the printing presses to pay for their spending.
Zimbabwe vs. WeimarIn Zimbabwe, the Mugabe government initiated a "land reform" program intended to correct the inequitable land distribution created by colonial rule. Ultimately, Mugabe's attempt to to bail out the poor at the expense of the wealthy is what triggered capital flight and loss of faith of the currency.
His reforms not only caused a flight of capital and human capital (the wealthy), they also led to sanctions by the US and Europe. In response, Mugabe turned on the printing presses but the loss of faith in the currency had already occurred.
In Weimar Germany, printing for war reparations kicked off hyperinflation. Wikipedia provides a good accounting in
Inflation in the Weimar Republic.
It is certainly not impossible for there to be a complete loss of faith in the US dollar, however there odds are extremely remote.
Can The Fed Cause Hyperinflation?I do not think the Fed itself can cause hyperinflation and more importantly I am sure they would not if they could. The reason is "
Hyperinflation Would End The Game"
- Hyperinflation by definition would destroy the currency and thus the banks
- Hyperinflation would destroy the wealthy and all their corporate bond holding
- Hyperinflation would destroy the Fed
- Hyperinflation would destroy the wealthy political class
To understand how powerless the Fed is, one needs to understand the difference between credit and money, how much the former dwarfs the latter, and what the Fed's role is in getting banks to lend. I discussed those ideas above and in far more depth in
Fiat World Mathematical Model.
Note that the Fed has no power to give money away. Nor would they do so if they could.
Unlike the Fed, Congress
could give money away.
I do not know if giving everyone in the US $60,000 would do it or not, but giving everyone $60,000 a month indefinitely would sure do it.
How likely is that?
The answer is 0%.
Hyperinflation? No WayPlease consider
Hyperinflation? No Way by Mike Whitney.
The Federal Reserve is not going to push the economy into Zimbabwean hyperinflation. That's pure bunkum. The Fed's plan is to weaken the dollar to boost exports and to force China to let its currency appreciate to its fair-market value. By purchasing $600 billion in US Treasuries (QE2), the Fed effectively reduces the supply of risk-free assets, which sends investors into riskier assets like stocks and commodities. Is there an element of class warfare in the policy?
You bet there is. It's a direct subsidy to the investment class while workers are left to face higher prices on everything from gasoline to corn flakes. It's a royal screw job. But while Ben Bernanke may be a prevaricating class warrior and a charlatan, he's not insane. He's not going to shower the nation with increasingly-worthless greenbacks like they were confetti.
It's ridiculous to wail about "money supply" when velocity is zilch. It's pointless to crybaby over "bank reserves" when people are broke. It's crazy to yelp about "printing presses" when lending is down, credit is contracting and the economy is mired in the most vicious slump in 80 years.
The hullabaloo about inflation is vastly overdone. China's not going to dump its $3 trillion stockpile of mainly USD and US Treasuries. Who started that cockamamie story? China's doing everything it can just to keep its currency cheap just so to keep its people working. Are they suddenly going to do an about-face and commit economic harikari just to strike a blow against Uncle Sam? No way.
GoldThe US has the largest gold reserves of any country.
It is pretty silly to think the dollar will go to zero when all it would take to stop hyperinflation would be convertibility at some high rate.
Charles Hugh Smith vs. FOFOAI have made the point numerous times that the Fed will not cause its own destruction, nor will Congress.
Charles Hugh Smith states the thesis eloquently in
The Mechanics of Hyperinflation: Bankers vs. Politicos If we take it as axiomatic that hyper-inflation is a political process, then we have to conclude that hyper-inflation serves some powerful interests who would support the policies that would bring it to fruition.
My problem with the "hyper-inflation is inevitable" school of thought is that I cannot identify what powerful interests would gain from the destruction of the currency and all financial wealth. A hyper-inflationary wipeout certainly wouldn't benefit the Financial Power Elites who hold the vast majority of the financial wealth. Yet it is this very Elite which wields the preponderance of political power.
Thus you end up with this untenable conclusion: the politically powerful Financial Elite will consciously choose to self-destruct. I don't buy that as a likely scenario. If inflation started destroying their wealth, then they would instantly influence political policy to reverse course to preserve their wealth.
In an incredibly long-winded rant FOFOA counters Smith in
Deflation or Hyperinflation?How will "the Elite" profit from hyperinflation? By being the first to spend the bills with new zeros added and thereby outrunning the rest of us in the race to spend and winning the competition to retain standard of living. Hyperinflation is the end result of the dollar-debt timeline, there is no other way it can end. Only the severity is a variable to be considered.
Ackerman Convinced by NonsenseAmazingly, that assertion by FOFOA was enough to convince Rick Ackerman, a hard core deflationist to change his mind and go straight from the deflation camp to the hyperinflation camp.
This prompted Gary North (an inflationist) to blast Ackerman in
Rick Ackerman Defects to the Hyperinflationist Camp After 30 Years Gary North writes ...
Incredible! Three decades of bad assumptions, yet all that it took to persuade his self-defining outlook him was an article on anonymous blog. All of a sudden, hyperinflation is "entirely consistent with human nature."
Out of the deep freeze and into the fire.
But what of non-hyperinflationary Charles Hugh Smith, who three weeks earlier had been a model for him? Gone!
Yes, Gary it is incredible because FOFOA's theory is not born out in practice.
Did the elite benefit in Weimar? Zimbabwe? Argentina? Anywhere?
If the elite benefited from purposeful hyperinflation we would have some history suggesting just that. So where is it?
Supposedly the Fed is going to cause this event, to (in FOFOA's words) "outrun the rest of us in the race to spend, winning the competition to retain standard of living".
Excuse me for asking but what lifestyle is Bernanke in a race to maintain? Janet Yellen? Anyone on the Fed?
In that respect, FOFOA's explanation is downright humorous.
Stack of Things Missed by Hyperinflationists - Trade math
- Reserve currency math
- Credit dwarfs currency and changes in credit and the value of credit are far more important than the changes we have seen in money supply.
- Failure to understand pricing currency of oil is meaningless
- Misconceptions about excess reserves (Please see Fictional Reserve Lending for a discussion).
- Not understanding limits and restrictions on the Fed
- Not understanding limits and restrictions on Congress
- Failure to understand peak oil will not cause hyperinflation. Heck, peak oil will not even cause inflation.
- Inflation in China, does not constitute inflation in the US.
- Unfunded liabilities do not constitute debt
- Myopia - The US is not the only country with massive structural problems. Let's stop pretending otherwise
- Failure to understand the Fed will not destroy itself and the banks by allowing hyperinflation
Not every hyperinflationist goes wrong on every point above. However, they all go wrong on point 12.
Point 12 alone is sufficient to debunk hyperinflation arguments.
In regards to point 8, it is important to understand inflation is a monetary phenomenon. Any rise in the price of oil will be offset by a drop in prices elsewhere, if money supply is constant. Right now, money supply is not constant, but it is rising far more rapidly in China than in the US.
In regards to point number 10, many hyperinflationists, Williams included makes the mistake of treating unfunded liability projections as debt. Social Security can be fixed for a decade or more simply by hiking the retirement age. Medicare is far more problematic, but Paul Ryan and others in Congress have solutions that can easily stave off a major catastrophe for a long time.
Unfunded liabilities are a huge problem, but let's not jump the gun with preposterous conclusions they will cause hyperinflation any time soon.
Theory vs. PracticePlease note that banks do not want hyperinflation or even massive inflation. The reason is simple: Banks will not want to be paid back with cheaper dollars, especially worthless dollars, and Congress is beholden to itself and the banks.
Hyperinflation could
theoretically come from massive sustained political will to bail out the little guy at the expense of the banks, the wealthy, and the political class. However, unlike Mugabe and Zimbabwe, neither the banks nor the Fed nor the political class wants to bail out the poor at the expense of the wealthy.
Indeed, Bernanke's, Paulson's, and Geithner's actions to date have done the exact opposite!
We have bailed out the banks at the expense of the ordinary taxpayer (keeping the little guy in debt).
This is what it comes down to: In theory, Congress can easily cause hyperinflation. In practice, they won't, and neither will the Fed. As Yogi Berra once quipped "
In theory there is no difference between theory and practice. In practice, there is."
Deflationists Won the Bet I bet a "crying towel" with a person commenting under the name "Heli-Ben" as to whether deflation or hyperinflation would occur first.
The bet is over and I demand my towel. Deflation happened.
My definition of deflation is a decrease in money supply and credit with credit marked-to-market. That clearly happened. So did a decrease in credit straight up. In fact, consumer credit is still declining as shown in the charts above.
The Case-Shiller housing adjusted CPI (my preferred measure of the CPI) went brutally negative at one point. Even the standard CPI went negative for a while as shown in the following chart.
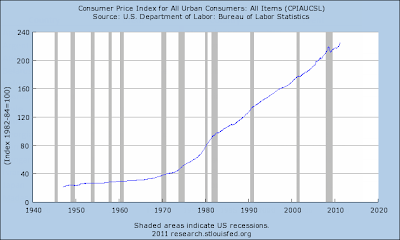
Prices did not stay negative long, but there is an unmistakable dip, the first dip since the Great Depression.
Whether the measure is credit, credit marked-to-market, or prices we had deflation.
More tellingly, we had deflation based on numerous conditions that one would expect to see in deflation: falling asset prices, falling treasury yields, rising junk bond yields, a rising US dollar, falling commodity prices, reduced speculation, etc.
The question now is whether or not we will see deflation
again, and if so how quickly.
Inflation vs. DeflationThe Us is certainly in a period of inflation now by my model. Home prices are making new lows and credit is in a funk, but most conditions appear inflationary at the moment.
Indeed if you believe the US will be in periods of inflation more often that deflation you may very well be correct, especially if your measure is the CPI. However, credit is a better measure than prices.
Consumer prices in Japan barely fell over the course of a 25 year period. Yet is is silly to argue that Japan never went in deflation. The conditions associated with deflation were frequent and persistent: falling consumer demand, the wiping out of excess leverage, a rising saving rate, and falling asset prices plagued Japan for decades.
My thesis has been the US would slip in and out of deflation for a number of years, just as Japan did.
I see no good reason to change that call. I expect another plunge in credit marked-to-market and another plunge in commodities. I expect another surge higher in the US dollar.
Yet, I have no faith in the grand super-cycle deflation theory where literally everything crashes.
I see no reason to predict the S&P 500 will drop to 200, or gold to $250.
Japan did not collapse yet, but it could. Moreover, Japan's debt at 200% of GDP shows just how out of hand things might get before the market imposes its will. Japan is a far better candidate for massive inflation than the US at the moment.
All it would take to sink Japan is a collapse in exports and a rise in interest rates to 3%. At 3% or so, interest on the national debt would consume 100% of Japan's revenue.
With that backdrop, the myopic focus on the US seems silly.
Unlike super-deflationist Robert Prechter, I expect gold to hold its value over the mid-term (another swoon is always possible) as the Fed fights massive deflationary forces of excess leverage, excess debt, boomer demographics, global wage arbitrage, cutbacks in state and local governments, and most importantly - consumer attitudes towards debt.
In the final analysis, it's all about attitudes. The Fed cannot force consumers or businesses to borrow or banks to lend (and it wouldn't for reasons stated, even if it could). In a fiat credit-based system, that is what matters.
Mike "Mish" Shedlock
http://globaleconomicanalysis.blogspot.com
Click Here To Scroll Thru My Recent Post List


