I have been reading many claims in many places lately that "The Fed is pumping M3". Others claim that Fed Open Market Operations (repos and coupon passes) are purposely being used by the Fed to fuel the stock market. Others still point to manipulation in gold. This post attempts to look at those claims.
Let's start with An Examination of Interest Rate Targeting, a 108 page PDF study of Open Market Operations in Australia by Liam J. O’Hara. The study was specific to Australia but it applies equally to the FOMC. Don't worry, I condensed the highlights down to a single page with my thoughts following.
The section below from "Study Highlights" thru "End Study Highlights" are excerpts from that PDF. I did not indent as I usually do because many of the snips below also contained indentations that I wanted to preserve without making things too hard to read.
Study Highlights
OMO is designed to fully accommodate the demand for system-wide liquidity in order to maintain stability in short-term interest rates [not] as a tool to manipulate the money supply.
Mosler (2002) again finds similar evidence:
The target [of OMOs] is an interest rate, so the New York Trading desk need only respond to changes in that interest rate. If the federal funds rate trades above its target, for example, it is a simple matter to make funds available at the appropriate interest rate for member banks to borrow on an as-needed basis. There is no functional value to knowing how much the banks need in advance. The Fed can always readily supply, and indeed must supply, any quantity of $US reserves the banks demand at the going rate, or the federal funds rate will not be on target. There is no inherent constraint on the quantity [of money] as the target is the interest rate and the quantity necessarily floats to meet bank demands, so the Fed has no need to “be prepared” for any quantity demanded.
An historical examination of OMO over the past 10 years highlights the fact that the Reserve Bank has fully accommodated the demand for cash in order to maintain cash interest rates at their target levels, and the settlement system functional.
While central banks have explicitly expressed the view that they target short term interest rates, and the money supply is determined outside the system by the demand for credit, proponents of the old exogenous money approach still perpetuate false and misleading statements. Recently, Friedman (1994) stated:
It’s simple to state how the money supply is so centrally controlled. It’s hard to believe. I have observed that noneconomists find it almost impossible to believe that twelve people out of nineteen…sitting around a table in a magnificent Greek temple on Constitution Avenue in Washington have the awesome legal power to double or two halve the total quantity of money in the country. How they use that power depends on [a range] of complex pressures…But that does not alter the fact that they and they alone have the arbitrary power to determine the quantity of what economists call base or high-powered money…And the entire structure of liquid assets, including bank deposits, money-market funds, bonds, and so on, constitutes an inverted pyramid resting on the quantity of high-powered money at the apex and dependent on it.
The findings of this thesis have concluded an opposite view. In Australia, the Reserve Bank fully accommodates the demand for its own liabilities or order to target a cost of funds to the banking system and not a prescribed money base quantity.
End Study Highlights
Mish Comments
Not only does the article by O’Hara debunk myths about open market operations, it also perforce debunks myths about "The Fed pumping M3", a statement I have seen at least twice a week for months on end. The Fed is not really in control of credit at all, and that is an idea that too few seem willing to accept.
Readers may wish to read
Possible targets of open market operations as well as
Current goals and procedures of open market operations for confirmation of O’Hara's study.
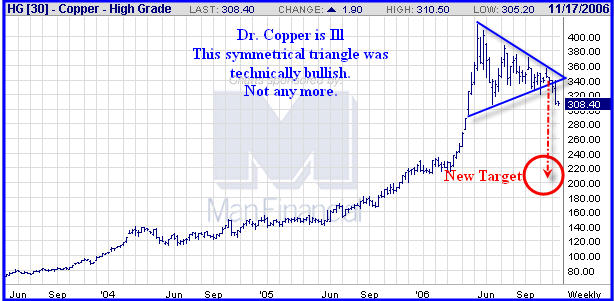
The key point is that the Fed can only target one variable at a time. This Fed has chosen to target interest rates and thus money supply and the price of gold will do what they want to at that rate. If the Fed chose to target money supply instead, the market would then determine the interest rate. If the Fed chose to target the price of gold, the market would then set the other variables. Thus the Fed is not really "Pumping M3" it is merely supplying the demand for money at the artificial rate it is has targeted (with an emphasis on artificial). This indeed is part of the problem, but it is important to state the problem correctly.
Remember that the Fed can not force anyone to borrow who does not want to, nor can the Fed force banks to lend. Regardless of whether the Fed targets money supply or interest rates or the price of gold, the Fed is NOT in control of bankruptcies, foreclosures, job hiring, or the velocity of money. Those last two sentences are crucial to the deflationary argument. Bankruptcies and foreclosures are soaring, consumer spending is sinking, and jobs will follow housing with a lag.
Liquidity Traps & HelicoptersThe current setup is essentially the liquidity trap that Japan fell into. Wikipedia has this (and much more) to say about
Liquidity Traps.
Milton Friedman suggested that a monetary authority can escape a liquidity trap by bypassing financial intermediaries to give money directly to consumers or businesses. This is referred to as a money gift or as helicopter money (this latter phrase is meant to call forth the image of a central banker hovering in a helicopter, dropping suitcases full of money to individuals).
...........
It has been suggested that the Japanese economy in the 1990's suffered from a "liquidity trap" scenario. This diagnosis prompted increased government spending and large budget deficits as a remedy. The failure of these measures to help the economy recover, combined with an explosion in the Japanese public debt suggest that fiscal policy may not have been adequate either. (Much of the government spending followed a stop/go pattern and involved spending on unneeded infrastructure.) American economist Paul Krugman suggests that, what was needed was a central bank commitment to steady positive monetary growth, which would encourage inflationary expectations and lower expected real interest rates, which would stimulate spending.
Milton Friedman is wrong and Japan proved it. Japan's national debt went from nowhere to 150% of GDP and they are still battling the aftermath of deflation for 18 years or more. For those wanting to see negative rants on Paul Krugman, try a
Google search for Krugman + Mises. My simple statement about Krugman is that he puts the cart before the horse when it comes to economic growth. Artificially stimulating the economy eventually causes all sorts of problems.
Please note that the idea of a "liquidity trap" essentially flows from a Keynesian approach to economic/monetary policy in the belief that there is not enough money in the system and things would somehow be better if more money could be forced into the system. Unfortunately, the Fed simply does not know the correct amount of money or the correct interest rate on it either any more than it knows how to set the correct price of orange juice or TVs. We do not let the Fed set the price of TVs, so why should the Fed set the price of credit? The liquidity trap develops because there eventually comes a point where the central bank simply can not force additional credit down the throats of prospective borrowers. Practice has shown that although central banks will attempt to fight the resultant deflationary tide they won't resort to helicopter drop methods. In this regard, the Fed has far less power than anyone realizes in spite of possessing vast power in theory.
In the ideal Austrian approach, a self-regulating free market economy would continually set interest rates and money supply at the correct levels. Any belief that there was not enough money floating around would be construed as pure nonsense. No function money can fulfill would be disturbed by the stable money supply inherent in a free market. The more goods and quality improvements the economy would produce, the higher the money's purchasing power would become over time. This is of course the exact opposite of what happens in a debt based fiat system. In the final analysis, the important thing is not how much money there is, but what that money can buy.
Who is to blame?It should be clear from the above that the Fed must take a big share of the blame for the mess we are in. The Fed has no real idea where interest rates should be and thus has no business setting them. This has even been admitted by the Fed itself as I pointed out in
Confessions by the Fed.
If credit exploded out of control to the upside then it is simply because the Fed kept interest rates too low too long. The problem is what to do about it. Bernanke is absolutely scared to death of a credit contraction here (and he should be). But the Fed also has to be spooked by the leveraged buyouts, merge mania, stock buybacks, and derivative madness fueling the stock market. Consumer credit and housing will dictate what happens next.
Snake EyesThe dice have been cast and the latest result was
snake eyes.
First we saw
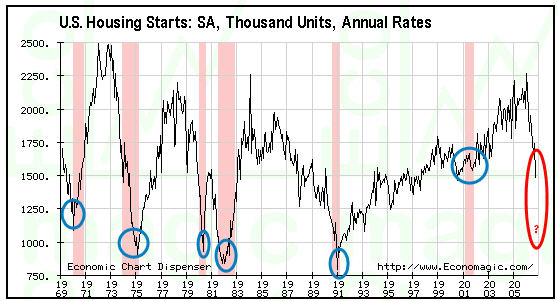
Consumer Credit Plunge, with the other die showing a massive decline in housing permits and starts (see
October Housing Starts, Permits, Foreclosures).
The box the Fed is in is of its own making, and that box keeps getting smaller and smaller. Eventually overall credit will start contracting regardless of what the Fed says or does, and the wizards behind the curtain will be exposed for the frauds that they are. This means that the Fed is going to be as out of control of the upcoming credit contraction as they were of the preceding credit expansion. It is the end of the line for the Fed and contrary to popular belief, open market operations are not going to hold things together.
RTA track record for 2006:Mish Note:
What follows is a promotion for Resource Trader Alert (a commodity options trading service by Kevin Kerr at Agora Financial). Several people have sent me private emails complaining about the hype in Agora's ads (and I agree - in public - that some are way over-hyped) so I asked Agora for a simple spreadsheet of all of Kevin Kerr's trades for 2006.
The record speaks for itself.
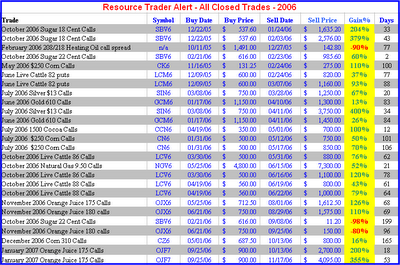 Click on the chart for a better view.
In the above table there are 23 winners and 3 losers. One of the losses has a date of 2005 but it was an options spread and a portion of that spread was closed for a loss in 2006.
Agora's legal department insisted the loss be included in trades for 2006.
Note that RTA is strictly an option picking service as opposed to futures, so your full risk for each and every trade is known in advance. All but 4 of the closed trades above had a maximum amount of $900 at risk.
Money Back GuaranteeAgora is currently offering a complete money back guarantee good for an entire year. Here is that guarantee:
As a special member and as part of this limited invitation, you'll have the right to cancel at any time during your membership. Yes, at any time. Even on the last day of your membership, for a refund of your full purchase price.
Disclosure:
Many of you know that I have a relationship with Agora, so yes I stand to benefit if someone signs up. But if anyone is aware of a better track record on commodities than the one I posted above then please let me know.
Past performance is of course no guarantee of future results, but for those interested in commodity trading with a limited predefined risk for each trade, with a right to a complete refund anytime for a full year, on a service with track record as good as Kerr's,
please click here to signup now. (Scroll to the bottom to ignore the hype on the signup page).
Prices are set to rise Midnight November 27, 2006.
Happy Thanksgiving Everyone!
Mike Shedlock / Mish
http://globaleconomicanalysis.blogspot.com/