
Imaginary Numbers
Mish Moved to MishTalk.Com Click to Visit.
Today's post is on Imaginary Numbers.
Some people are not aware of it but, there are actually two kinds of imaginary numbers.
For a mathematical answer to the question "What is an imaginary number?" all one has to do is Ask Dr. Math .
The other kind of imaginary number comes from CEOs, the US government, and places like the National Association of Realtors (NAR). Today's lesson is about the NAR.
The National Assn. of Realtors reported Thursday that sales of existing single-family homes rose 5.2% last month to a seasonally adjusted annual rate of 6.91 million units. The biggest increase in two years took economists by surprise. They had expected a drop of about 1% after five months of declines.
Here are a couple of charts:
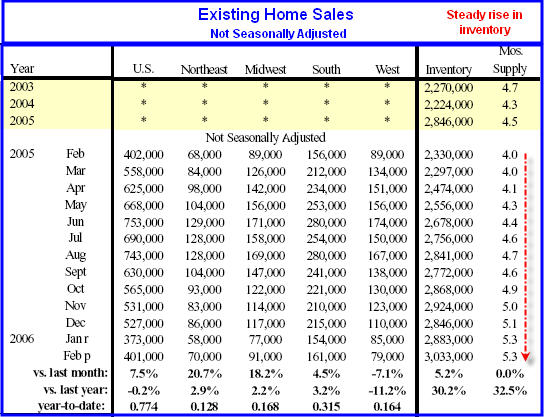
Notice the steady rise in inventory.
Notice also that although sales were "reportedly" up vs. last month, they were still down as compared to the same month last year.
The telepathic question lines are now open.
I am flooded with two questions.
1) OK Mish so what?
2) Why do you call those numbers imaginary?
Those are both good questions.
Here is one explanation as to why they are imaginary: The NAR existing home sales numbers are "survey numbers". The NAR should easily be able to provide exact numbers by adding up the numbers from all the local real estate boards. Can this be difficult with today's computers? Instead they do a quick survey of questionable accuracy.
Let's take our own sample.
California
Sales fell for 5th consecutive month and were 1.7% below February 2005. Inventory is up from a year ago by 40.5%. Nominal year over year prices fell for 2nd month in a row.
The Orange County Register says: Selling a home? You're not alone.
Let's face it. There's only reason to look at the Realtors' monthly existing-home-sale report: the dirt on inventories. So here's February's "Unsold Inventory Index" for single-family detached homes being sold by owners:Inman News is reporting California home sales plunge 15.5%
* The O.C.: 10.4 months worth of homes to sell vs. 5.7 months for the same period a year ago.
* California: 6.7 months vs. 3.2 months a year ago.
* U.S.: 5.3 months vs. 4 months a year ago.
Unsold inventory levels climb to highest in several years, trade group says.Florida
Existing-home sales dropped significantly in California in February, falling 15.5 percent from the same period a year ago, as inventory levels climbed and median prices continued to escalate, an industry trade group reported today.
Closed escrow sales of existing, single-family detached homes in California totaled 513,745 in February at a seasonally adjusted annualized rate, down from 608,160 a year ago, according to the California Association of Realtors. Median prices increased 13.7 percent to $535,470 from $470,920 a year ago.
Meanwhile, the February 2006 median price of an existing home in the state decreased 2.9 percent compared with January's $551,300 median price.
The Florida Association of Realtors is reporting a 20% decrease in sales.
ORLANDO, Fla., March 23, 2006 Statewide, sales of single-family existing homes totaled 13,539 in February compared to 16,916 homes a year ago, for a 20 percent decrease, according to the Florida Association of Realtors® (FAR).Virginia
Seven out of eight 7 out of 8 areas comprising the Northern Virginia Association of Realtors had fewer sales. All eight reported higher inventory levels.
Another telepathic question just came in:
Mish, do you have any evidence at the national level?
Yes, actually I do. Here goes:
MBA Applications
The Mortgage Bankers Association (MBA) reports Mortgage Application Volume Down Slightly In Latest Survey.
WASHINGTON, D.C. (March 22, 2006) — The Mortgage Bankers Association (MBA) today released its Weekly Mortgage Applications Survey for the week ending March 17. The Market Composite Index — a measure of mortgage loan application volume was 565.0 – a decrease of 1.6 percent on a seasonally adjusted basis from 574.4 one week earlier. On an unadjusted basis, the Index decreased 1.6 percent compared with the previous week but was down 13.8 percent compared with the same week one year earlier.Hmmm. Lets see... The Purchase Index four week moving average is down to 401.5. It was 470 in October, 448 in December, and 447 in January. Does that sound like nationally increasing sales? Whatever is going on with the February numbers, be it real or imaginary, the overall trend should be clear to all but the most obstinate of real estate bulls: Sales Lower, Inventories Higher.
The seasonally-adjusted Purchase Index decreased by 2.3 percent to 393.6 from 403.0 the previous week whereas the Refinance Index decreased by 0.6 percent to 1574.5 from 1583.6 one week earlier. Other seasonally adjusted index activity includes the Conventional Index, which decreased 1.4 percent to 833.4 from 845.2 the previous week, and the Government Index, which decreased 4.4 percent to 117.4 from 122.8 the previous week.
The four week moving average for the seasonally-adjusted Market Index is down 0.2 percent to 574.0 from 575.3. The four week moving average is down 0.4 percent to 401.5 from 401.9 for the Purchase Index while this average is down 0.2 percent to 1588.8 from 1593.4 for the Refinance Index.
The refinance share of mortgage activity increased to 38.1 percent of total applications from 37.7 percent the previous week. The adjustable-rate mortgage (ARM) share of activity decreased to 28.3 percent of total applications from 28.8 percent the previous week.
Missouri
Let's look at one more item hot off the press today:
The Kansas City Star is reporting First default, then despair.
Rising interest rates and a cooling real estate market conspire to undermine the financial well-being of homeowners and feed an increase in foreclosures.Real Numbers
More first-time and lower-income homebuyers are losing the American dream to foreclosures on the courthouse steps.
Real estate experts in Kansas City and nationwide say they are seeing a trend in which homeowners — often using adjustable-rate mortgages — have been unable to keep up with fast-rising interest rates, forcing them to balance higher monthly payments against already soaring energy costs and living expenses.
Making matters worse, experts say a cooling real estate market makes it less likely that financially strapped consumers can count on rising home values and equity to bail them out.
“Many people are living on the razor’s edge,” said Kansas City mortgage attorney Berry S. Laws III. “When their interest rates go up, they automatically have to pay more for the mortgage. People are betting their homes will appreciate, but if the value of their homes flattens out, they face a deficit.”
The warning signs are everywhere:Last year, foreclosures rose 25 percent, according to RealtyTrac of California.
- The Mortgage Bankers Association reports that the number of home-loan delinquencies nationwide in the last quarter of 2005 grew to a 2½-year high.
- The association also noted a growing inventory of foreclosed homes, suggesting that banks are getting stuck with repossessed homes they can’t resell.
- Foreclosure.com recently reported that the total number of foreclosures listed for sale in December rose 12.7 percent, reversing a recent trend of declining foreclosures. The online foreclosure-tracking firm estimated that about 92,000 foreclosed homes were on the U.S. market.
Nationally, bank regulators worry that mortgage delinquencies and resulting foreclosures will continue to increase this year.
“Rising mortgage delinquencies in 2005 apparently mark the end of a period of generally improving mortgage loan performance between 2002 and 2005,” said Richard A. Brown, chief economist for the Federal Deposit Insurance Corp., which insures banks.
According to FDIC statistics, the average 30-day past-due rate for subprime mortgages — those made to borrowers with limited or less than perfect credit — rose from 5.4 percent at the beginning of 2005 to 7.1 percent at year’s end, reversing an eight-year decline.
Missouri and Kansas borrowers may be faring worse.
Missouri’s average 30-day past-due rate rose last year from 7 percent to 9.2 percent, the FDIC said. Kansas’ rose from 5.7 percent to 7.6 percent.
Myra Batchelder, who heads the economic opportunity program at Demos, a New York think-tank on consumer issues, sees an ominous future for many Americans.
“The recent jump in foreclosures is a sign of a much larger problem: The American household economy is at a breaking point,” Batchelder said.
Bankruptcy obstacles
Some experts are predicting that the bankruptcy reform law that was adopted last year threatens to fuel an additional round of foreclosures.
The idea behind the law was to make it harder for consumers to shed debts. One big change requires credit counseling 180 days before filing for bankruptcy.
In the past, consumers who couldn’t pay their debts could go to a bankruptcy lawyer and immediately stop a foreclosure and at least keep a portion of their home’s value.
Not anymore, said Laws, the Kansas City mortgage attorney.
If homeowners can’t make house payments during the 180-day period before being approved to file for bankruptcy, Laws predicted, “they won’t be able to save their house. It’s a mess.”
- Mortgage indebtedness grew by $2 trillion in 2004 and 2005 alone.
- Subprime lending grew 25 percent annually from 1994 to 2003, accounting for one of 10 home loans.
- Qualifying debt-to-income ratios for subprime loans have risen from 28 percent to more than 55 percent.
- U.S. average 30-day past due rates for subprime loans rose from 5.4 percent to 7.1 percent in 2005.
- Average 30-day past due rates for subprime loans in Missouri rose from 7 percent to 9.2 percent in 2005.
- Average 30-day past due rates for subprime loans in Kansas rose from 5.7 percent to 7.6 percent in 2005.
“The recent jump in foreclosures is a sign of a much larger problem: The American household economy is at a breaking point.”
Mike Shedlock / Mish
http://globaleconomicanalysis.blogspot.com/


