
Falling Family Incomes
Mish Moved to MishTalk.Com Click to Visit.
According to the Federal Reserve Board’s Survey of Consumer Finances over the 2001–04 period, the median value of real (inflation-adjusted) family income before taxes rose 1.6 percent, while the mean value fell 2.3 percent. These results stand in contrast to the strong and broad gains seen for the period between the 1998 and 2001 surveys and to the smaller but similarly broad gains between the 1995 and 1998 surveys.
In short, this was a recovery unlike any other. A Few charts should prove it:
Income 1995 vs. 2004
Income 2001 vs. 2004 by age group
Not only has mean real income fallen, it has fallen disproportionately on those aged 44 and under. Median income has also fallen for those aged 44 and under even though it has risen slightly across all age groups.
Net Worth 1995 vs. 2004
Net Worth 1995 vs. 2004 (click on chart for better view)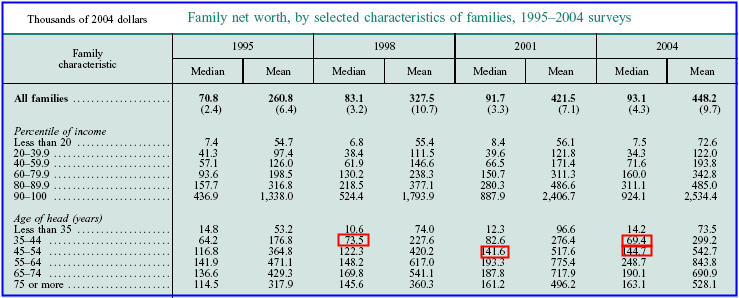
Net worth in the period 1995-1998 and 1991-2001 dramatically outpaced the rise from 2001-2004. Those in the 35-44 age group have less real net worth than the same age group did in 1998. That is negative real net worth over a 6 year period for a group of wage earners that should be nearing their peak earning years.
The Federal Reserve Report explains this complex set of statistics by three factors:
- Strong appreciation of house values and a rise in the rate of homeownership produced a substantial gain in the value of holdings of residential real estate.
- Despite the general recovery of prices in equity markets since 2001, the direct and indirect ownership of stocks declined, as did the typical amount held.
- The amount of debt relative to total assets increased markedly, and the largest part of that increase was attributable to debt secured by real estate.
The report missed two key ideas:
- The Empty Nest Effect
- An Understated CPI
The other key factor is the CPI. As bad as the graphs look, they are in fact much worse because the CPI has been hugely understated for a long time.
CPI Chart from the FED

Does anyone believe that?
I don't and I am a devout deflationist.
The idea that annual inflation between 1995 and 2004 was 2-3% is preposterous.
Long time Mish readers might be thinking that is inconsistent with my deflationist views, but it is not. A credit crunch and a housing bust will indeed be very deflationary, but that is a look ahead. The CPI for the period in question is no doubt horribly understated.
What age group was most affected by higher CPI? Could it be families with kids with increased school expenses, medical expenses, food expenses, driving expenses, energy costs, etc., perhaps with one parent in a part time job to better accommodate the needs of the kids? With that in mind, note how college education costs have been skyrocketing. I am not sure how anyone manages to put their kids through college. Indeed many parents can't and kids are coming out of college with enormous debt levels facing wages that simply have not kept up with expenses.
Real Savings

Notice the drop in savings rates across nearly all age groups. Even those whose real net worth has been rising the most (age 55-64) is showing a drop in savings. This shows how more and more people have been viewing their house as savings. Net worth is up, but so too is the debt side of the ledger. Falling home prices just might be about to shatter the dreams of those who thought forever rising home prices would continue to support consumption during retirement. Also interesting is the rise is savings in the age group under 35. Is this a result of marriage being delayed and women attempting to start a career first before starting their families?
The Rich Get Richer
A CBS news article on falling family incomes notes the discrepancy between the haves and the have nots.
The gap between the very wealthy and other income groups widened during the period.Nothing Succeeds Like Failure
The top 10 percent of households saw their net worth rise by 6.1 percent to an average of $3.11 million while the bottom 25 percent suffered a decline from a net worth in which their assets equaled their liabilities in 2001 to owing $1,400 more than their total assets in 2004.
"This is the continuing story of the rich getting richer," said David Wyss, chief economist at Standard & Poor's in New York. "Clearly, the gains in wealth are going to the top end."
Democrats used the new report to blast President George W. Bush's economic policies, contending it would be wrong to make permanent his tax cuts which primarily benefited the wealthy.
"These statistics show why, even though GDP is rising, most people do not feel better off," said Sen. Charles Schumer, a New York Democrat.
While surging home values have supported consumer spending in recent years, analysts worry about the economic impact if, as expected, the home price surge begins to slow this year.
"This report shows a race between factors boosting net worth such as home ownership and factors pushing the other way such as weak wage growth. Unless we start to see better income growth from jobs and wages, it is hard to see major gains in net worth for the typical family." said Jared Bernstein, senior economist at the liber Economic Policy Institute, a Washington think tank.
Speaking on behalf of the "have nots" was Warren Buffett in the 2005 Berkshire Hathaway annual report
Too often, executive compensation in the U.S. is ridiculously out of line with performance. That won’t change, moreover, because the deck is stacked against investors when it comes to the CEO’s pay. The upshot is that a mediocre-or-worse CEO aided by his handpicked VP of human relations and a consultant from the ever-accommodating firm of Ratchet, Ratchet and Bingo – all too often receives gobs of money from an ill-designed compensation arrangement.CEO Pay vs. the Average Employee
Take, for instance, ten year, fixed-price options (and who wouldn’t?). If Fred Futile, CEO of Stagnant, Inc., receives a bundle of these – let’s say enough to give him an option on 1% of the company – his self-interest is clear: He should skip dividends entirely and instead use all of the company’s earnings to repurchase stock. CEOs understand this math and know that every dime paid out in dividends reduces the value of all outstanding options.
Getting fired can produce a particularly bountiful payday for a CEO. Indeed, he can “earn” more in that single day, while cleaning out his desk, than an American worker earns in a lifetime of cleaning toilets. Forget the old maxim about nothing succeeding like success: Today, in the executive suite, the all too prevalent rule is that nothing succeeds like failure.
Huge severance payments, lavish perks and outsized payments for ho-hum performance often occur because comp committees have become slaves to comparative data. The drill is simple: Three or so directors – not chosen by chance – are bombarded for a few hours before a board meeting with pay statistics that perpetually ratchet upwards. Additionally, the committee is told about new perks that other managers are receiving. In this manner, outlandish “goodies” are showered upon CEOs simply because of a corporate version of the argument we all used when children: “But, Mom, all the other kids have one.” When comp committees follow this “logic,” yesterday’s most egregious excess becomes today’s baseline.
Those rising wage averages that we have seen have never been as skewed as that are today. Consider the following snip from a Speech by SEC Commissioner Roel C. Campos on February 13, 2006.
In 1982, the ratio between chief executives and the average employee was 42:1. In 2004, the ratio of the average CEO pay to that of the average non-management worker in the US was 431:1. There is certainly no evidence that today's executives in the U.S. are 10 times better than twenty years ago. The US ratio far exceeds any international comparison, which remain closer to the historical average. Although internationally there has been a trend towards increased "US-style" pay, according to a 2001 report by management consultants Towers Perrin the same ratio in other heavily developed nations was 25:1 in the case of the UK, 16:1 in France, 11:1 in Germany and as low as 10:1 in Japan (as compared to 531:1 in the US in that same year).Insider Bailing
Of course, one must recognize that some of the disparity has been due to governmental constraints such as the restriction on granting of stock options. In Japan and Korea, for example, it was not until 1997 that such restrictions were lifted. Even so, the 10:1 ratio in Japan versus the 531:1 ratio in the US in 2001 is stunning.
Take a look at KBH Insider Sales for just one example of insiders bailing on massive stock options while touting stock buybacks to investors. You can find hundreds of companies doing the same thing if you look.
How does this affect the "average Joe"?
One of the ways is that the averages are skewed. Stock options, mergers, bonuses, leveraged buyouts, and insane CEO compensation packages all are helping those on the top end to get enormously wealth. Average salaries are rising. But "Average Joe" is not seeing a dime of it. We have a trickle down economy that is melting up for the top 5-10% while subtracting dollars from "Average Joe" to pay for it. Add in understated inflation and it's no wonder the savings rate has been negative for a year.
Personal Savings Rate
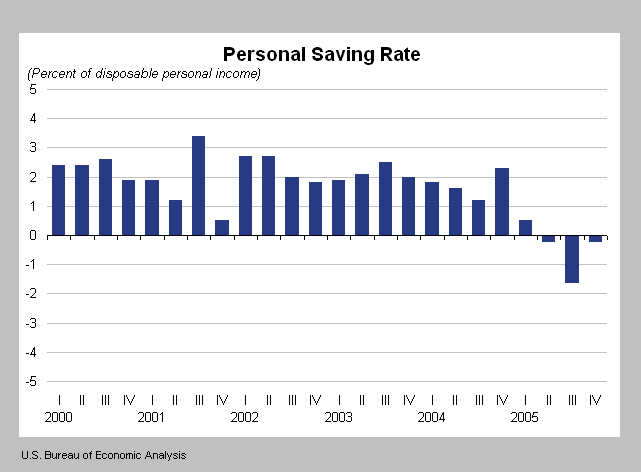
We have not had a falling savings rate on a yearly basis since 1933. This is clearly a sign of stress. It can only get worse as interest rates rise and housing stalls. Expect more bankruptcies and foreclosures because more of each are coming.
Snow Job
On March 3rd, Treasury Secretary Snow proclaimed Failure to save seen as confidence in future paychecks.
In a telephone interview with The Chronicle, Snow said that he thinks wages now are at a "tipping point" where they will start rising.The idea that a negative savings rate can be interpreted as "people feel good about their prospective earnings, the sustainability of their jobs and the strength of the job markets" is one of the most absurd statements he has ever made. Consumer confidence is actually falling, housing has stalled, and higher interest rates are not helping cash strapped consumers.
Snow said a detailed report from the Federal Reserve last week showing that average household incomes were stagnant from 2001 to 2004 was based on out-of-date data.
Snow also put a positive spin on Americans' negative savings rate. Recent studies have shown that in 2005 average spending outpaced earnings for the first time since 1933 as people financed consumption by dipping into savings or taking on debt.
"One way to look at it is that people tend to consume out of their expected long-term income," he said. "The strong consumption could be interpreted, probably should be interpreted, as a vote of confidence in the direction of the economy and the fact that people feel good about their prospective earnings, the sustainability of their jobs and the strength of the job markets."
The lies and distortions coming out of this administration are simply staggering. Many people are spending every dime and more, not as a vote of confidence but because they have to in order to put food on the table and clothes on their backs, and heat their house. Others are just simply living beyond their means encouraged by an explosion in credit granted to anyone that can breathe. If ever there was a "vote of no confidence" it would be the bankruptcy reform act of 2004. Banks and other lenders are clearly worried about not being paid back. As well they should be.
The Gini Index
Stephen Roach hit the nail on the head on March 3rd with Globalization's New Underclass.
Billed as the great equalizer between the rich and the poor, globalization has been anything but. An increasingly integrated global economy is facing the strains of widening income disparities -- within countries and across countries. This has given rise to a new and rapidly expanding underclass that is redefining the political landscape. The growing risks of protectionism are an outgrowth of this ominous trend.Unlike Treasury Secretary "Blue Skies No Snow" I see no reason for this to change. Corporate profits (and bonuses for the haves) soared with every outsourcing of jobs to India and China. Average Joe went deeper in debt while the CEOs and insiders made out like bandits on stock options. Average Joe lost his job at GM and Ford (or is about to) and will be happy to have a job at Walmart instead.
It wasn’t supposed to be this way. Globalization has long been portrayed as the rising tide that lifts all boats. The surprise is in the tide -- a rapid surge of IT-enabled connectivity that has pushed the global labor arbitrage quickly up the value chain. Only the elite at the upper end of the occupational hierarchy have been spared the pressures of an increasingly brutal wage compression. The rich are, indeed, getting richer but the rest of the workforce is not. This spells mounting disparities in the income distribution -- for developed and developing countries, alike.
With per capita income of $38,000 and $1,700, respectively, the US and China are at opposite ends of the global income spectrum. Yet both countries have extreme disparities in the internal mix of their respective income distributions. This can be seen in their so-called Gini coefficients -- a statistical measure of the dispersion of income shares within a country. A Gini Index reading of “0” represents perfect equality, with each segment of the income distribution accounting for a proportionate share of total income. Conversely, a reading of “100” represents perfect inequality, with the bulk of a nation’s overall personal income being concentrated at the upper end of the distribution spectrum. In other words, the higher the Gini Index, the more unequal the income distribution. The latest Gini Index readings for the US (41) and China (45) are among the highest of all the major economies in the world -- pointing to a much greater incidence of inequality than in economies with more homogeneous distributions of income, such as Japan (25), Europe (32), and even India (33).
America’s Gini coefficient has been on the rise for over 35 years -- moving up from about 35 in 1970 to over 40 today. What is new is how America’s income distribution has become more unequal in a period of rapidly rising productivity growth -- a development that has been accompanied by an extraordinary bout of real wage stagnation over the past four years. Economics teaches us that in truly competitive labor markets such as America’s, workers are paid in accordance with their marginal productivity contribution. Yet that has not been the case for quite some time in the US. Over the past 16 quarters, productivity in the nonfarm US business sector has recorded a cumulative increase of 13.3% (or 3.3% per annum) -- more than double the 5.9% rise in real compensation per hour (stagnant wages plus rising fringe benefits) over the same period.
First in manufacturing, now in services, the global labor arbitrage has been unrelenting in pushing US pay rates down to international norms. But the real wage compression in the US has not been uniform across the income spectrum. In large part, that has occurred because increasingly broad segments of the American labor market are now exposed to a uniquely powerful competitive force -- the IT-enabled arbitrage. Courtesy of the hyper-speed of sharply accelerating Internet penetration, the global labor arbitrage has pushed into areas that historically have been unaccustomed to wage competition.
This recovery produced lots of firsts
- Negative Savings Rates
- Negative Real Wages
- Poor expansion of private sector jobs
- Rising Debt
- No Trickle Down Flows
The housing boom is all but over and Secretary Snow is right about one thing: This economy is at a tipping point. Unfortunately he is wrong about the direction. From where I sit, it looks ready to fall off a cliff.
Mike Shedlock / Mish
http://globaleconomicanalysis.blogspot.com/


