
What does the "Take this Job and Shove-It Indicator" say about the Economy?
Mish Moved to MishTalk.Com Click to Visit.
With a salute to Johnny Paycheck, inquiring minds are investigating the CNBC claim ‘Shove It’ Indicator Turns Positive: More People Quitting
Call it the “Take This Job and Shove It” indicator. The latest report from the Bureau of Labor Statistics shows that an increasing number of people are quitting their jobs, a sign of an upturn in consumer confidence and the economy, according to one economist.Job Openings and Labor Turnover Survey
“There is one area where there does appear to be some additional risk taking, and that is seen in the number of people leaving their jobs,” said Don Rissmiller, economist for Strategas Research Partners. “The last time we saw an inflection point of this sort in the number of people quitting their jobs, we were at the end of the last ‘jobless recovery’ in 2003.”
In October 2 million individuals quit their jobs, up from 1.7 million during the same month a year ago, according to the Bureau of Labor Statistics. On its web site, the BLS states, “Quits tend to rise when there is a perception that another job is available and tend to fall when there is a perception that jobs are scarce.”
The rise in quitting is accompanied by an increase in the job outlook in the latest survey by staffing firm Manpower and an ISM survey of managers indicating bigger capital expenditures planned for next year, Rissmiller points out in his note.
With that lead-in let's turn our focus on the BLS Job Openings and Labor Turnover Survey for October 2010.
Number of Unemployed Per Job Opening

click on any chart in this post for a sharper image
While admitting the trend looks very favorable, please note the ratio was 2.0 at the end of the 2001 recession. It is roughly 4.5 now. Furthermore, at the end of the last recession, the indicator rose for another 2 years.
Here is the alleged Take This Job and Shove It” indicator.
Quits vs. Layoffs and Discharges

While this indicator did indeed turn up (making a higher low in December 2009), the indicator has done little but flatline since April 2010, a full 6 months. Maybe it continues and maybe it doesn't. Moreover, it has to rise by another 500,000 just to get to the August 2003 low.
Note that layoffs and discharges did revert to the mean plus an overshoot which should be expected. The number of quits is nowhere near its trendline.
Weekly Unemployment Claims
Today's weekly unemployment claims number remains headed in the right direction, but +421,00 is hardly anything to crow about except in relative terms.

The 4-week moving average of weekly claims shows that things are definitely getting better. However, the number of weekly claims is still at mid-recession levels of the past 5 recessions. Worse yet, claims are falling much slower than any previous recession to get to this 420,000 level.
Population Changes
For more discrepancies please consider the BLS November Jobs Report
The unemployment rate is based off the BLS household survey. The November numbers follow.
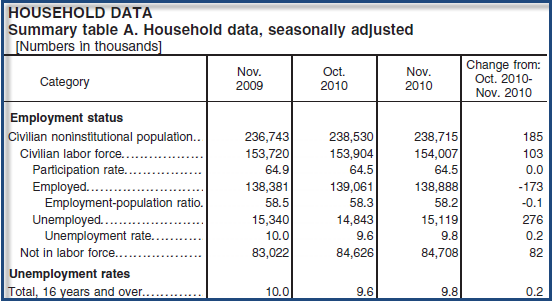
Last year the civilian population rose by 1,972,000. However, the labor force rose by a mere 287,000. Those not in the labor force rose by 1,686,000. Had it not been for the drop in participation rate, the unemployment rate would have been 10.8%. Here is the math ((15,119+1,686)/(154,007+1,686) ) * 100 = 10.8%
US Population vs. Employment, vs. Labor Force, vs. Continued Unemployed

The recent spike in continued unemployed is especially aggravating given the flat growth in employment.
6 Million Benefits Paying Jobs Vanish
Please consider 6 Million Benefits-Paying Jobs Vanish and Unemployment Rate Drops!
Analysis of weekly unemployment data and covered employees shows that 5,977,844 benefit-paying jobs have been lost in the last year.
click on chart for sharper image
The above chart is from reader Tim Wallace. I added the date and numeric annotations. Thanks Tim!
Covered Employment Stats of Merit
- Covered employment is back to 2004 levels.
- Close to 6 million benefits paying jobs have vanished in a year.
- Over 8 million benefits paying jobs have vanished since the 2008 peak.
What is a Covered Employee?
The exact meaning of "covered employee" varies slightly state to state, but not by much. In simple terms it means one is eligible for unemployment insurance benefits.
Most states exclude the self-employed, commission based employment such as real estate agents, those in student training programs, academic and hospital internships, employment by churches or religious organizations, and rehabilitation programs.
Self-employed individuals must pay into unemployment insurance programs, however, the self-employed are not eligible for benefits anywhere.
Nearly 6 Million Jobs Vanish
By the above interpretation, it is safe to conclude that 5,977,844 jobs totally vanished (not just benefit paying jobs).
The only way that cannot be true is if there was a sudden shocking increase in the number of real estate agents, church hiring, or close to 6 million people all of a sudden decided to go into business for themselves.

Although employment is not in the depths of hell like it was in late 2008, and while the "Shove-It Indicator" is a positive divergence (assuming it continues up), it is one hell of a stretch to parlay this into the idea that employment approaches a self-sustaining inflection point.
There is far more going on than the "Shove-It Indicator" allegedly indicates, especially since it is flatlining.
Mike "Mish" Shedlock
http://globaleconomicanalysis.blogspot.com
Click Here To Scroll Thru My Recent Post List

What does the "Take this Job and Shove-It Indicator" say about the Economy?
Posted by Michael Shedlock at 2:35 AM

